







Plinth

Designing a go‑to‑market
system for health
data experts

HealthtechB2B / EnterpriseDesign StrategyBrand & Communication Design

I partnered with the founders of Plinth—a data science consultancy navigating complex B2B sales—to rethink how they positioned, packaged, and sold their expertise. I led the team through workshops and discovery to develop a deeper understanding of their customers, then put that understanding to work through a sharper GTM strategy, cohesive brand system, and suite of sales collateral.

Timeline
2023, 2026
Role
Design Consultant
Scope
Discovery, Strategy, Positioning, Brand, Communication Design, Design Systems
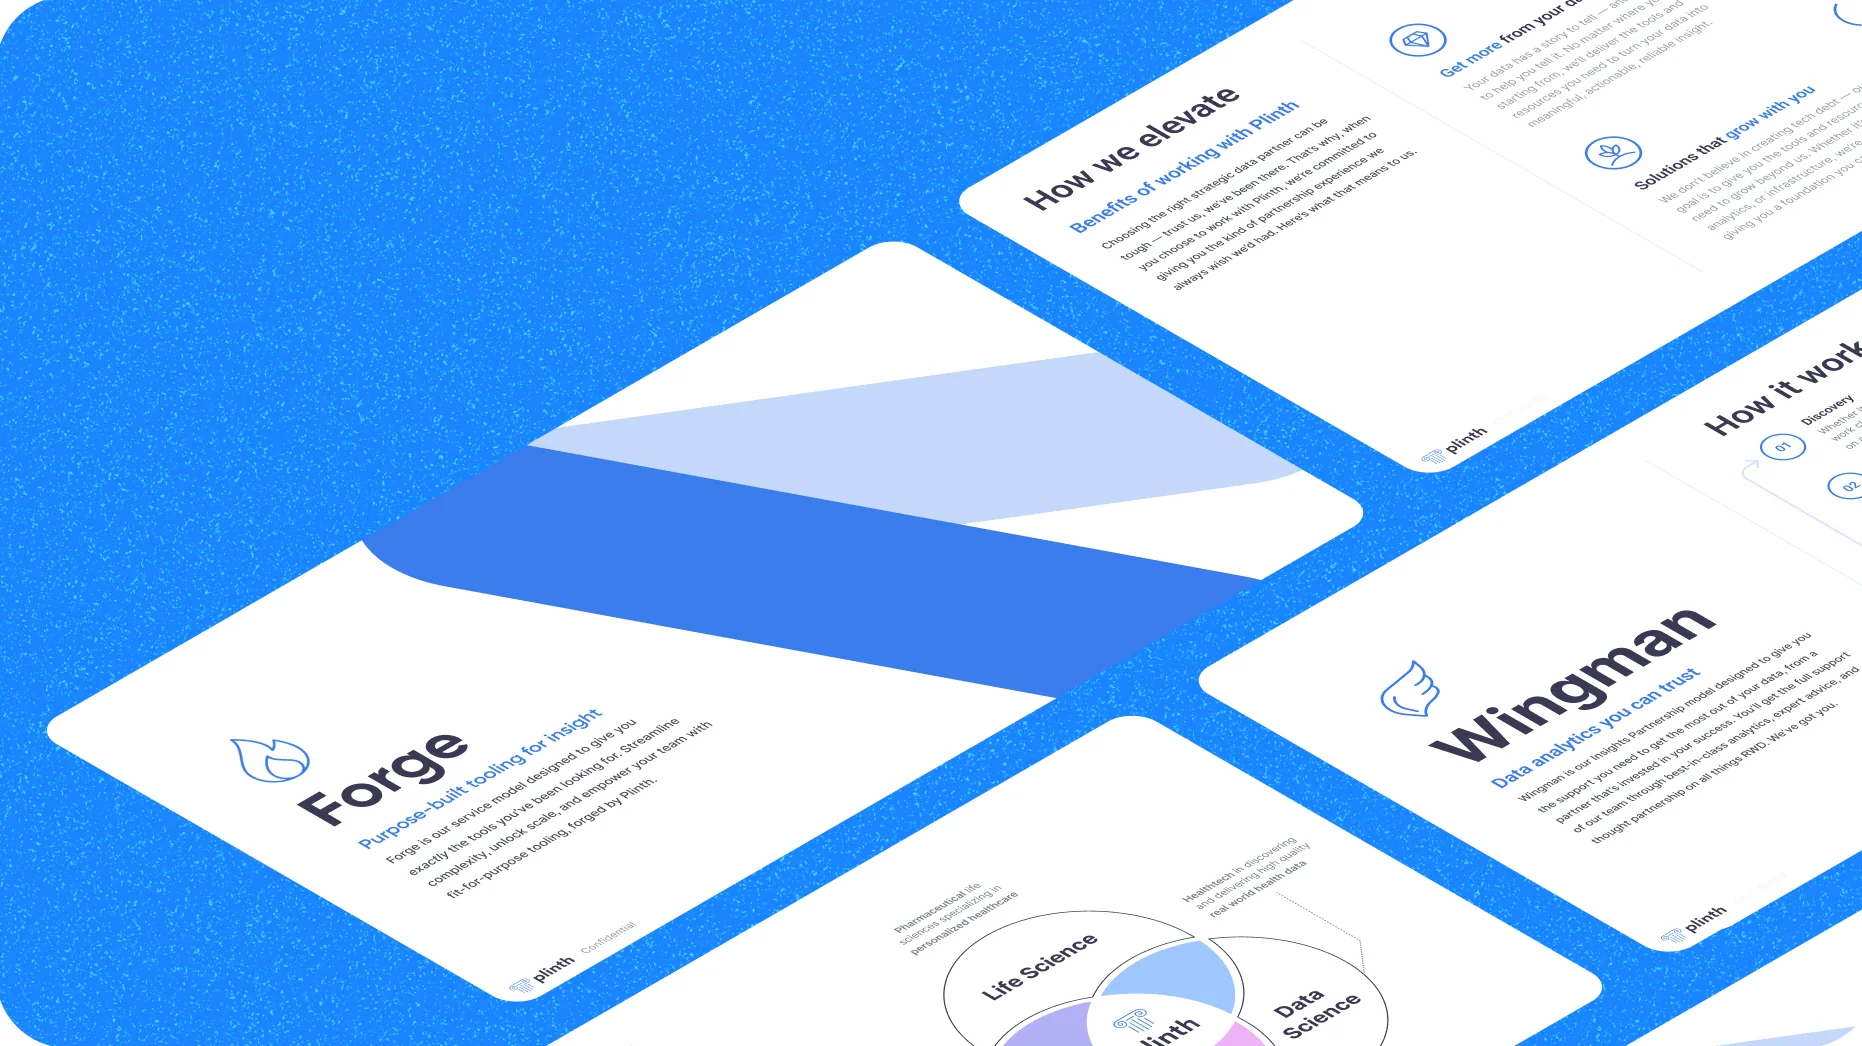
Spreads from the 2023 Plinth sales deck: the Forge and Wingman service covers, a benefits slide and a positioning diagram.

Overview

My role

  • Led discovery process and value prop mapping to clarify positioning and align messaging with customer pain points
  • Developed two distinct service models, including value propositions, packaging, and branded identities
  • Designed a suite of turnkey sales collateral (pitch deck, brand system) enabling a consistent, repeatable sales motion

Impact

  • 2× increase in quarterly deal volume within 6 months of delivery
  • Reduced average time-to-close by 40% (5 weeks → 3 weeks)

Plinth is a real-world-data consultancy for pharma and life sciences, founded by two PhD data scientists. Its clients include top-ten pharma companies, and every engagement was built around that client’s problem.

In 2023 I worked with the founders to define what Plinth sells and how it explains it: two clearly different ways to work with the team, and a sales deck that tells one consistent story. In 2026 I came back to design a set of sales one-pagers the team can keep extending on its own.

The challenge

“What does Plinth do?”

It’s a simple question, but one that founders Kieran and Nathaniel found difficult to answer concisely for prospects.

Plinth’s work was exceptionally technical and highly bespoke. The team brought deep expertise spanning data science, engineering, and life sciences to a broad range of client problems, often through very different kinds of engagements. That flexibility made the business hard to sell, and harder to scale.

Every deal started à la carte. The team had to work out which capabilities were relevant, what kind of engagement made sense, and how to scope, price, and plan the work. Proposals could take days to prepare, and much of the process, from the first conversation to a signed contract, depended on the founders.

We had the technical expertise but struggled to articulate what we actually offered in a way that resonated with prospects.
Kieran Mace, PhDFounder & CEO, Plinth Analytics

Discovery & positioning

Connecting Plinth’s expertise to what customers valued

Sitting in on sales conversations gave me a front-row seat to the challenge at hand. Prospects often sought an experienced partner who could help them navigate analytical decisions and carry the work forward with their team. Understanding what customers valued in that relationship became an important part of defining how Plinth would present its expertise.

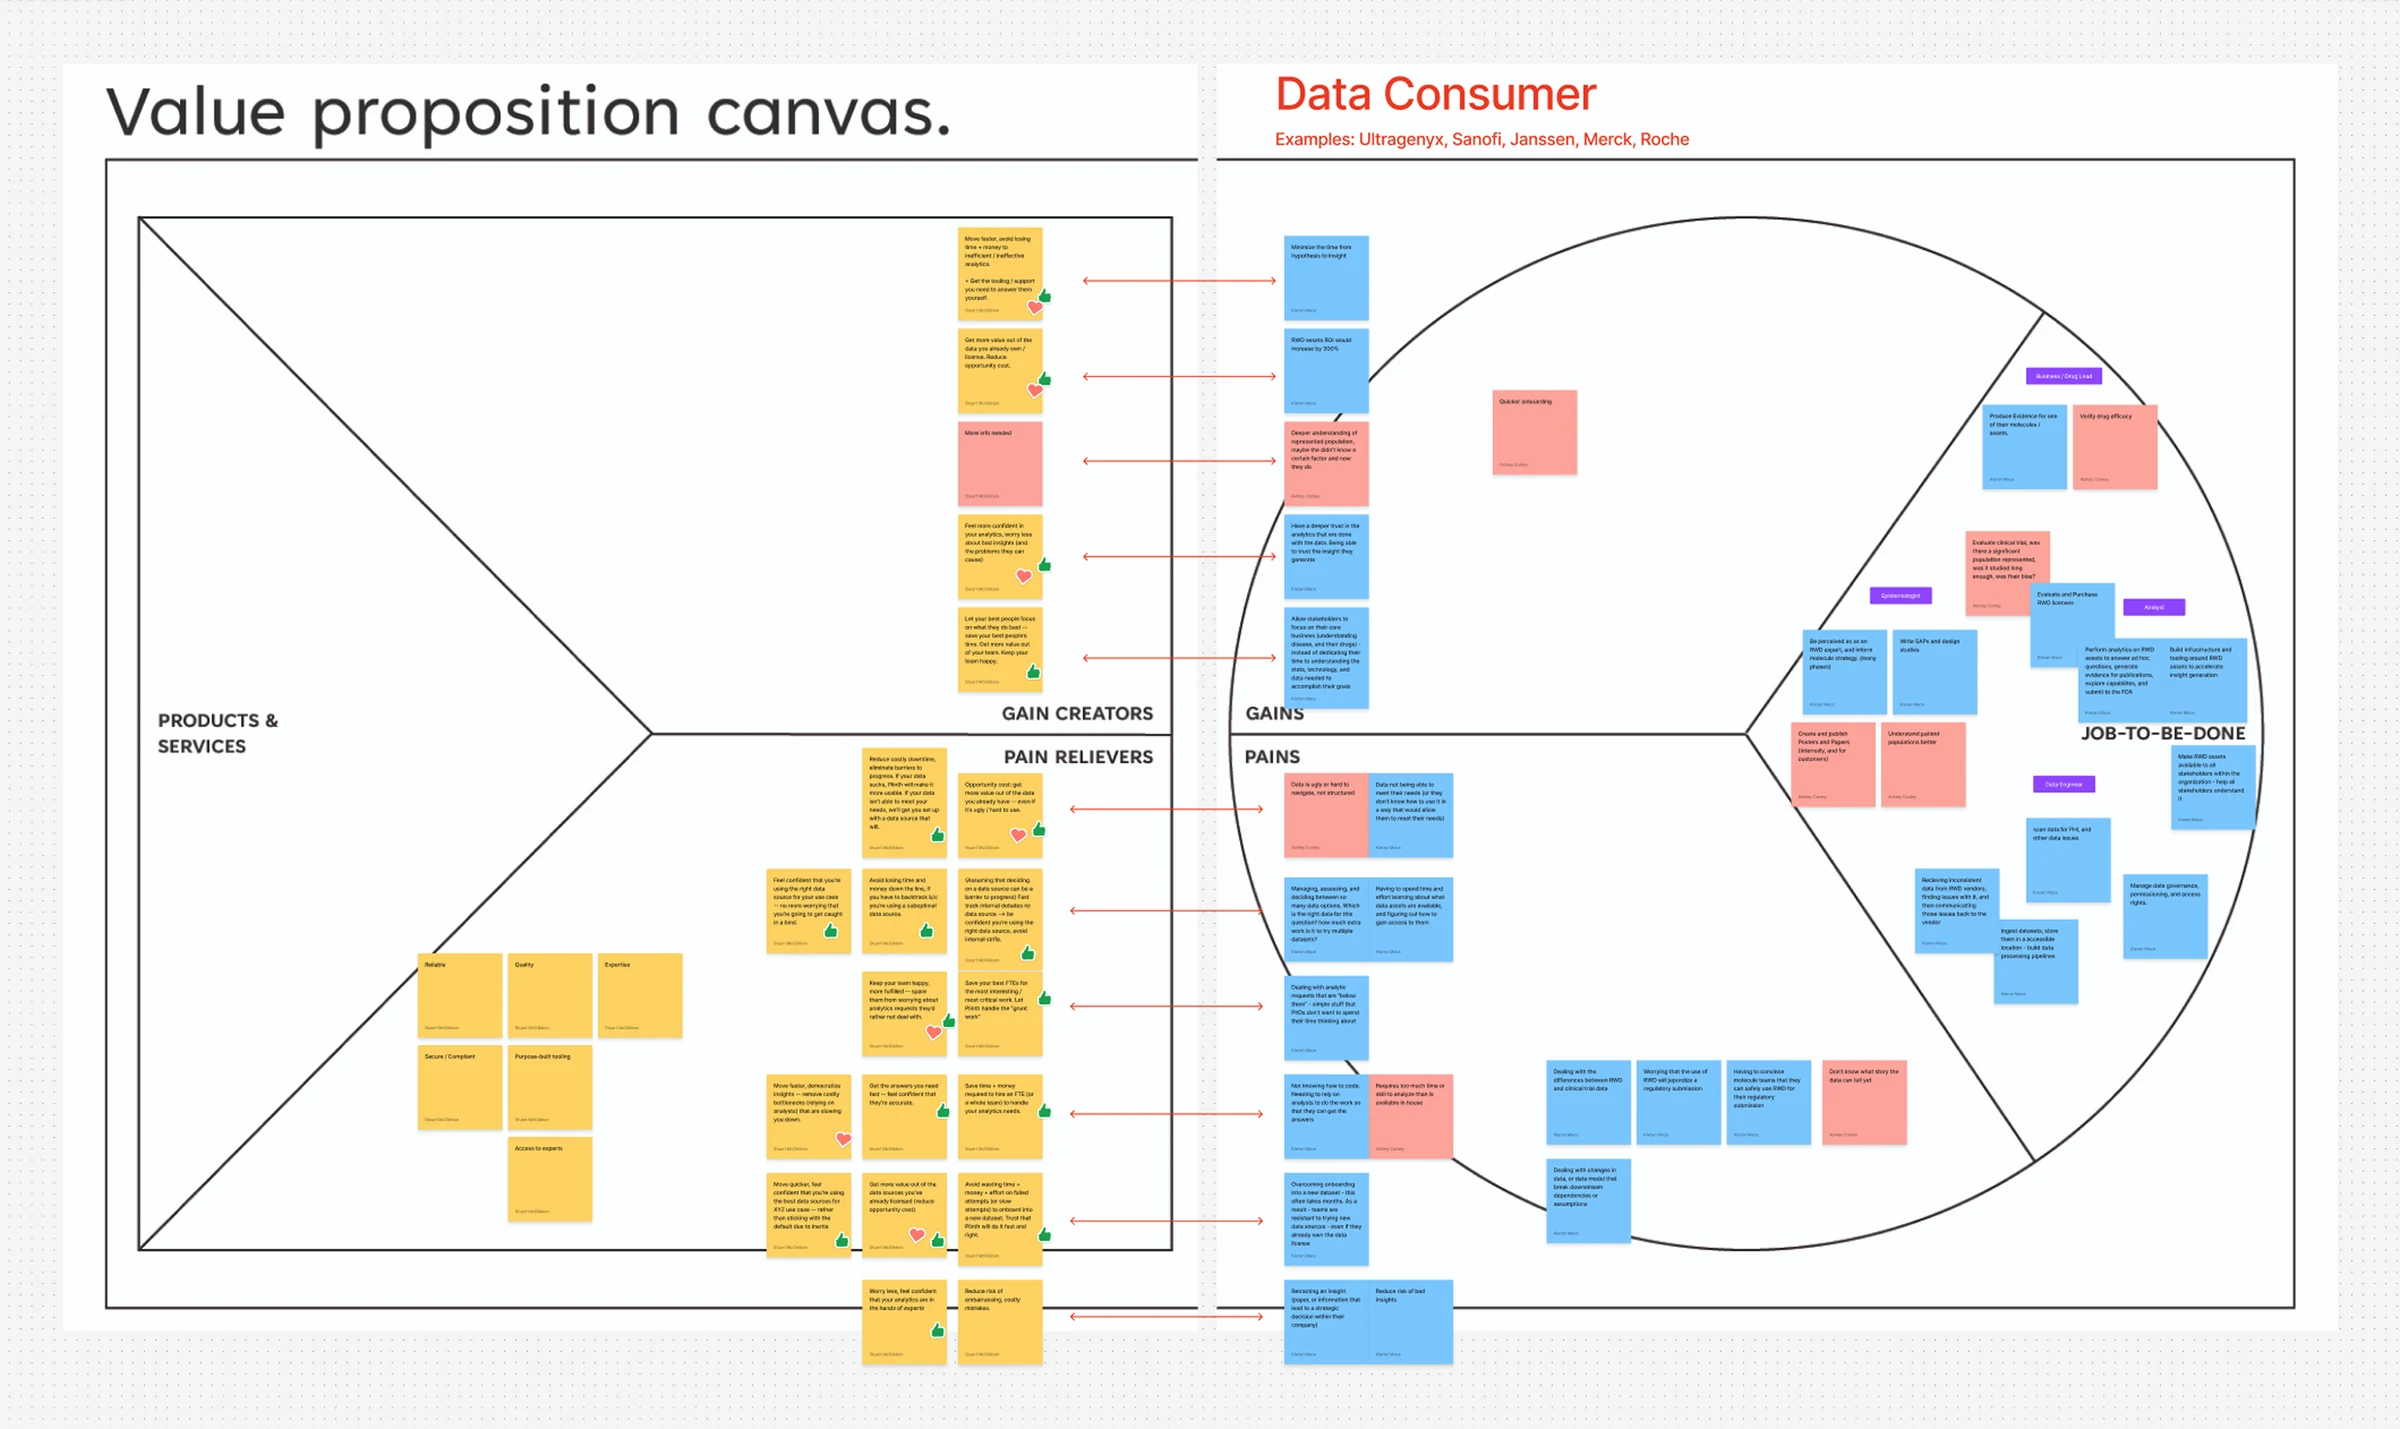
In a series of workshops with the founders and their team, I introduced the Value Proposition Canvas to connect the founders’ knowledge of their customers with a clearer picture of the value Plinth could offer. This framework gave us a structure for examining that fit across Plinth’s two main audiences: companies producing health data, and the companies consuming that data for research.

Value proposition canvas for data consumers: customer jobs, pains and gains on the right, mapped by arrows to the gain creators and pain relievers on the left.
The Value Proposition Canvas: aligning customers’ jobs, pains and gains with the value Plinth could create, to establish problem–solution fit.

What emerged from our synthesis was a set of value propositions for each audience: some distinct to one or the other, but many that pointed toward themes that cut across both.

Data producers

  • Help customers adopt and get value from their data quickly
  • Build a reputation as a trusted source of high-quality data
  • Make data delivery more reliable
  • Scale delivery without growing services overhead
  • Meet deadlines without adding headcount

Data consumers

  • Get more value from data they already license
  • Empower non-technical teams to answer more of their own questions
  • Choose the right data source for their use case
  • Start working with new datasets quickly
  • Avoid costly analytical errors
  • Remove bottlenecks, free up specialists for higher-value work

A producer maintaining fragile delivery code and a research team dependent on an overloaded analyst faced different constraints, but both could benefit from tooling that gave their teams more independence. Four shared themes rose to the top:

Get more from your data

Turn the data clients already have into reliable, actionable insight.

Confidence in the results

Analytics and engineering from experts, so clients can act on what they find.

Solutions that grow with you

Tooling and infrastructure clients can maintain and extend, without tech debt.

A partner who’s been there

Experience on both sides of the real-world data market.

This synthesis gave us a solid foundation for a more informed messaging strategy and a bank of value propositions to draw upon as we developed new materials.

Service design

Architecture of a successful engagement

Plinth brought deep expertise across data science, engineering and life science, yet the shape of any particular engagement was amorphous at the outset. It emerged only after the founders had invested substantial time across multiple conversations defining the problem and aligning on a path forward. They needed a clearer way to articulate what working together could look like and what it could deliver, giving prospects and the team a shared starting point for shaping an engagement.

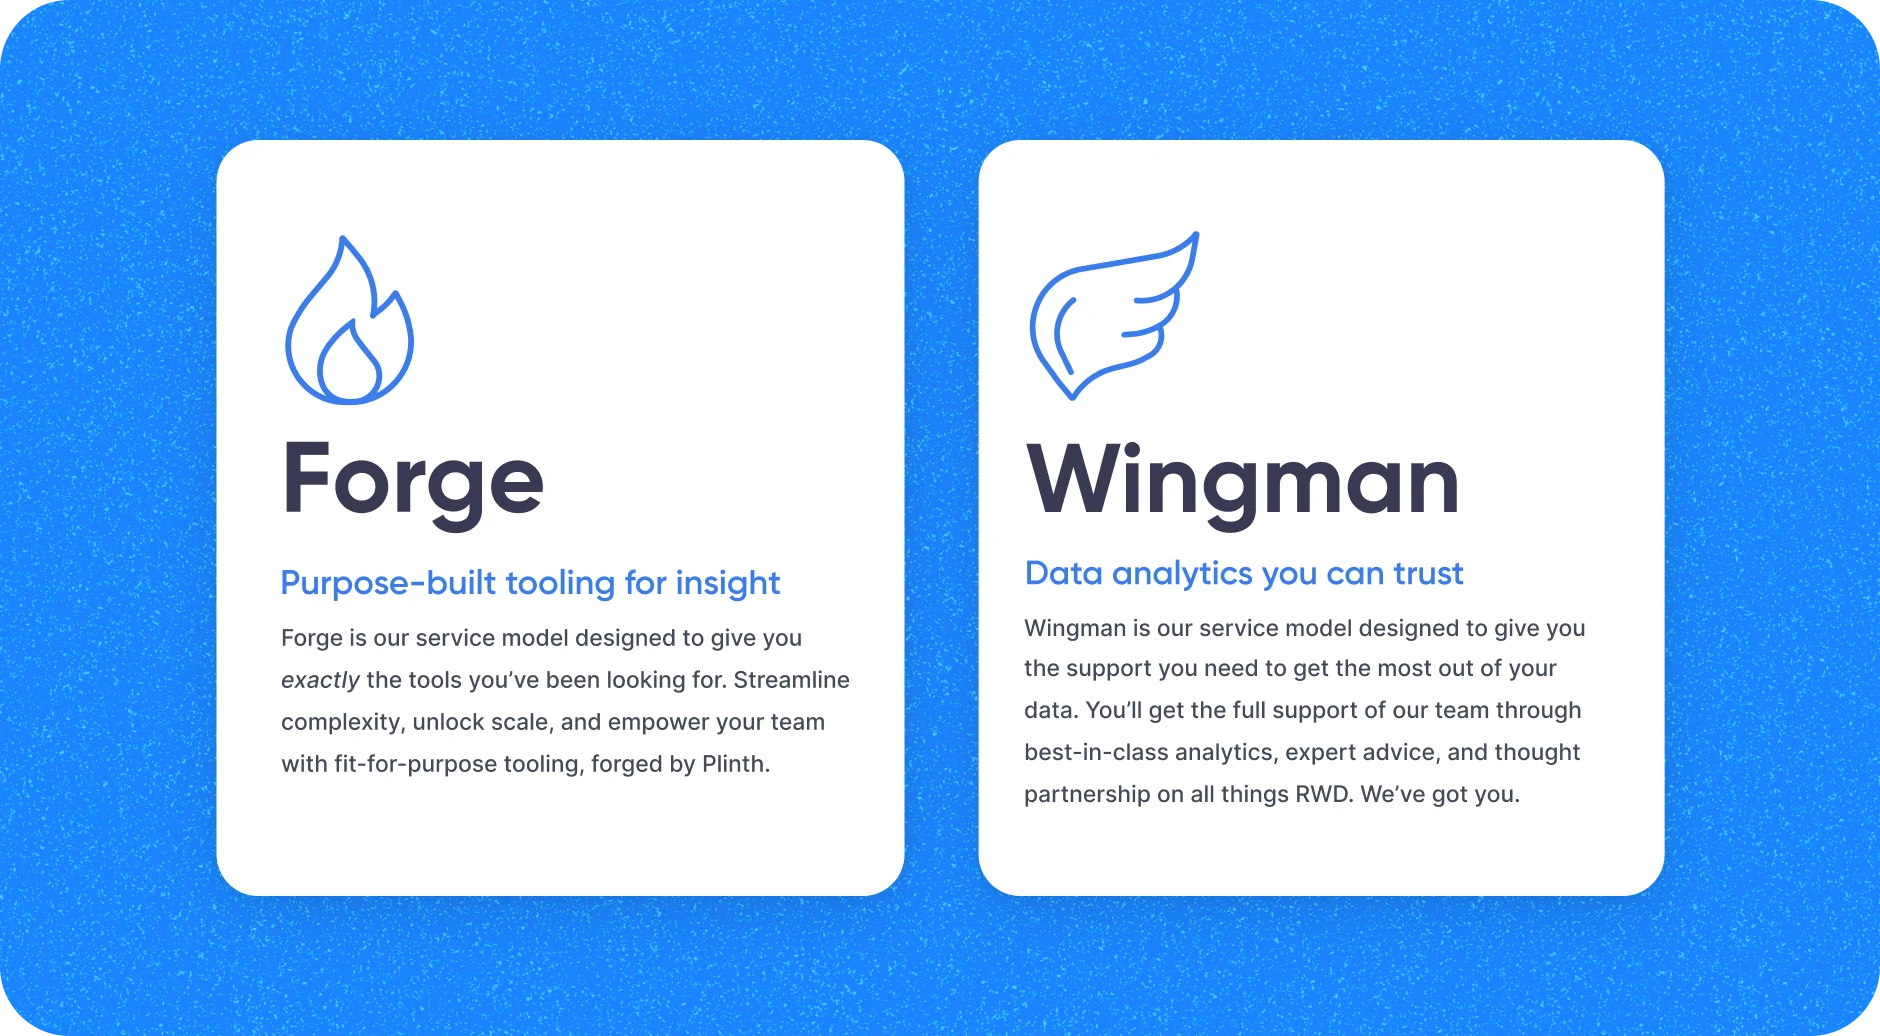
Working with the founders, I developed branded partnership models that gave Plinth a structure for positioning, packaging and pricing its expertise. We anchored them around a simple distinction — doing versus building — and gave each an identity prospects could quickly grasp, remember and refer to. The result was Forge and Wingman.

Forge and Wingman cover cards: a flame and a wing icon, each with its name, tagline and a short description.
The two partnership models, each with its own name, promise and identity.

The two models gave prospects an accessible starting point: tools and infrastructure built around their needs, or analytical expertise working alongside their team. That distinction established the shape of a potential engagement early, giving sales conversations structure before getting into technical requirements and detailed scoping.

We developed each symbol from the parent brand’s classical roots, giving each model an identity prospects could grasp at a glance.

The identities made that frame tangible, and extended the Plinth brand in the process. Their flame and wing symbols drew on the classical imagery already present in Plinth’s name and column mark. The forge’s fire evokes making and creation; the single wing evokes a guardian or guide, a capable partner who has your back. Each name and symbol captured the essence of its model at a glance, with a little wit, while building on the character of the parent brand.

Do vs. build

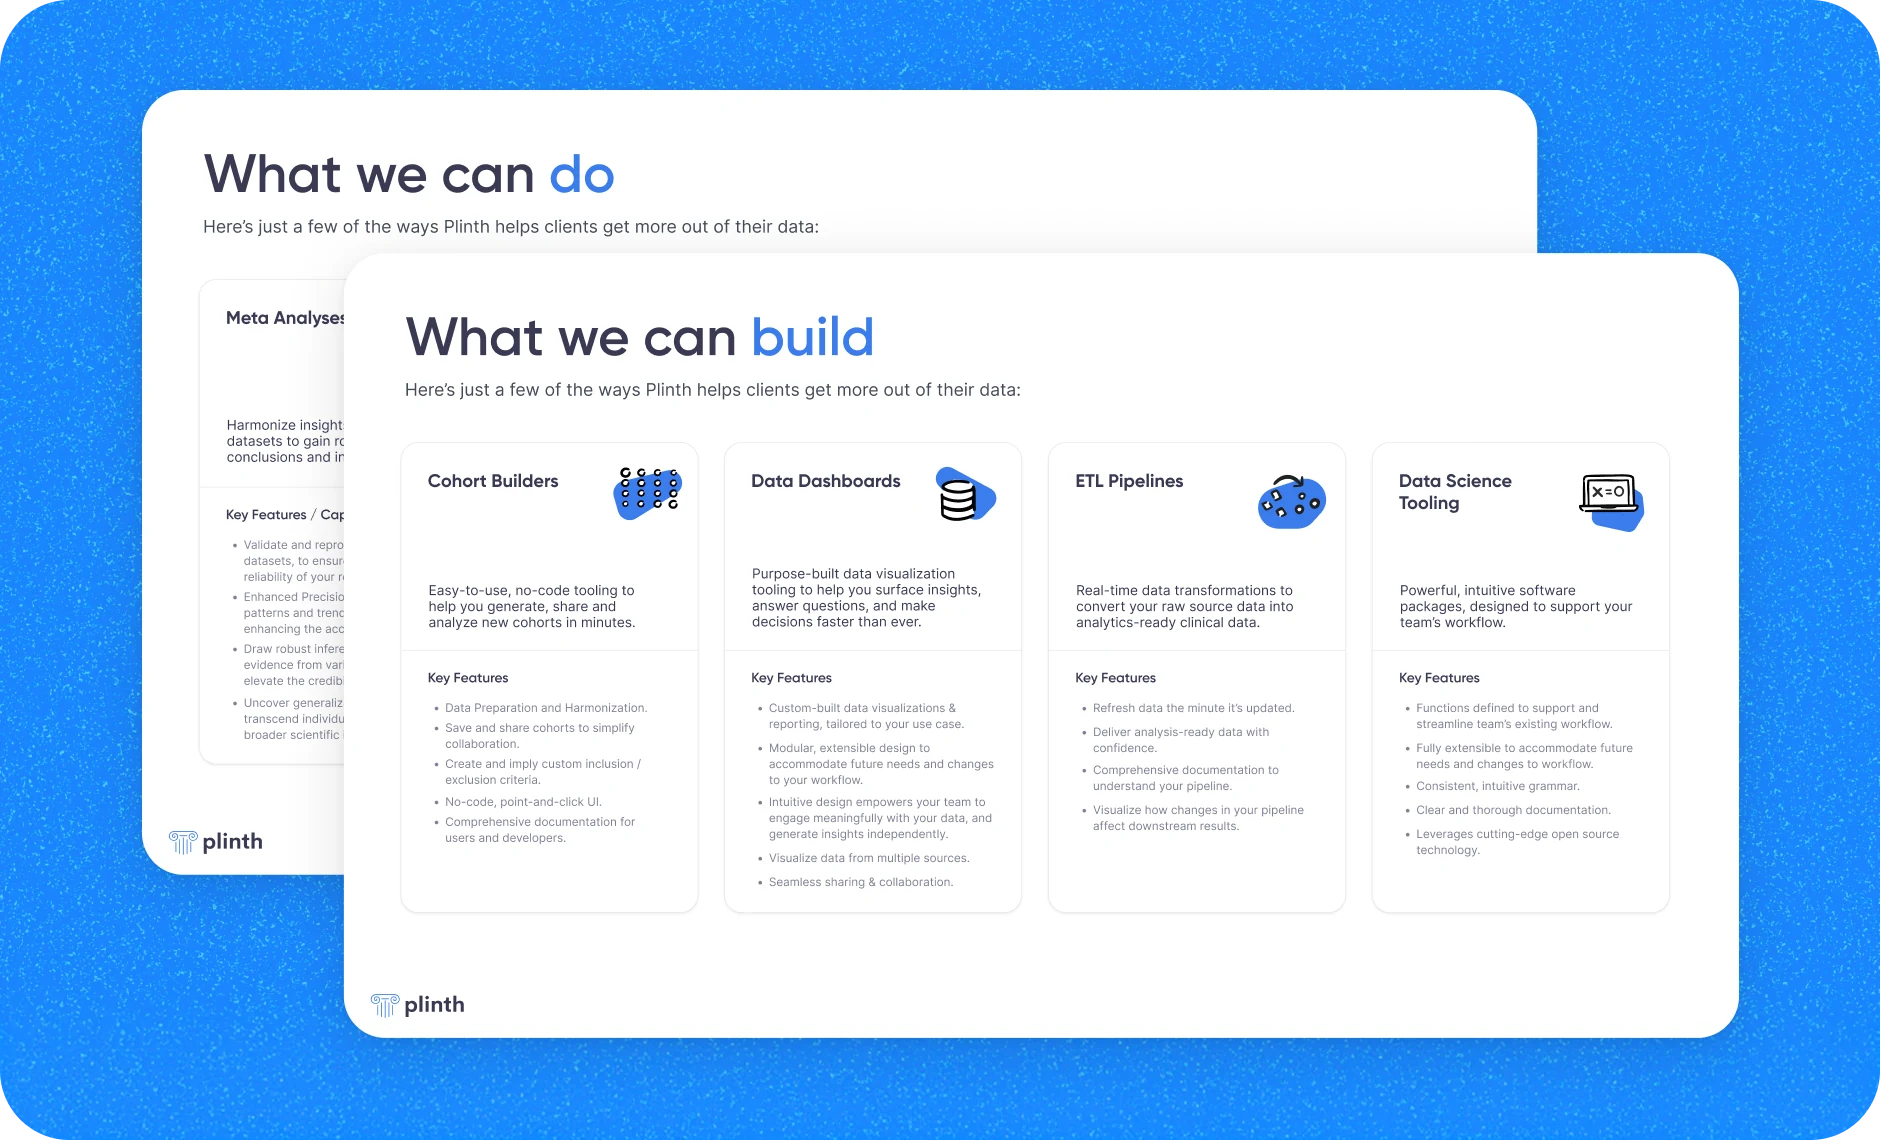
Build and do distilled the distinction into two familiar actions. In a field full of technical vocabulary, those words gave prospects an intuitive sense of the work’s shape from the very first conversation. “What we can build” and “What we can do” carried that clarity into the materials, supported by examples of what each model could deliver and what working together would involve.

Story & system

Developing the pitch, and the means to extend it

The deck brought the positioning into a form the team could use with prospects. I developed its narrative and visual system with the founders, turning what we’d learned into a clear account of the problems Plinth could solve and the expertise it brought.

  1. 1Identity
  2. 2Value
  3. 3Service models
  4. 4Samples

Identity

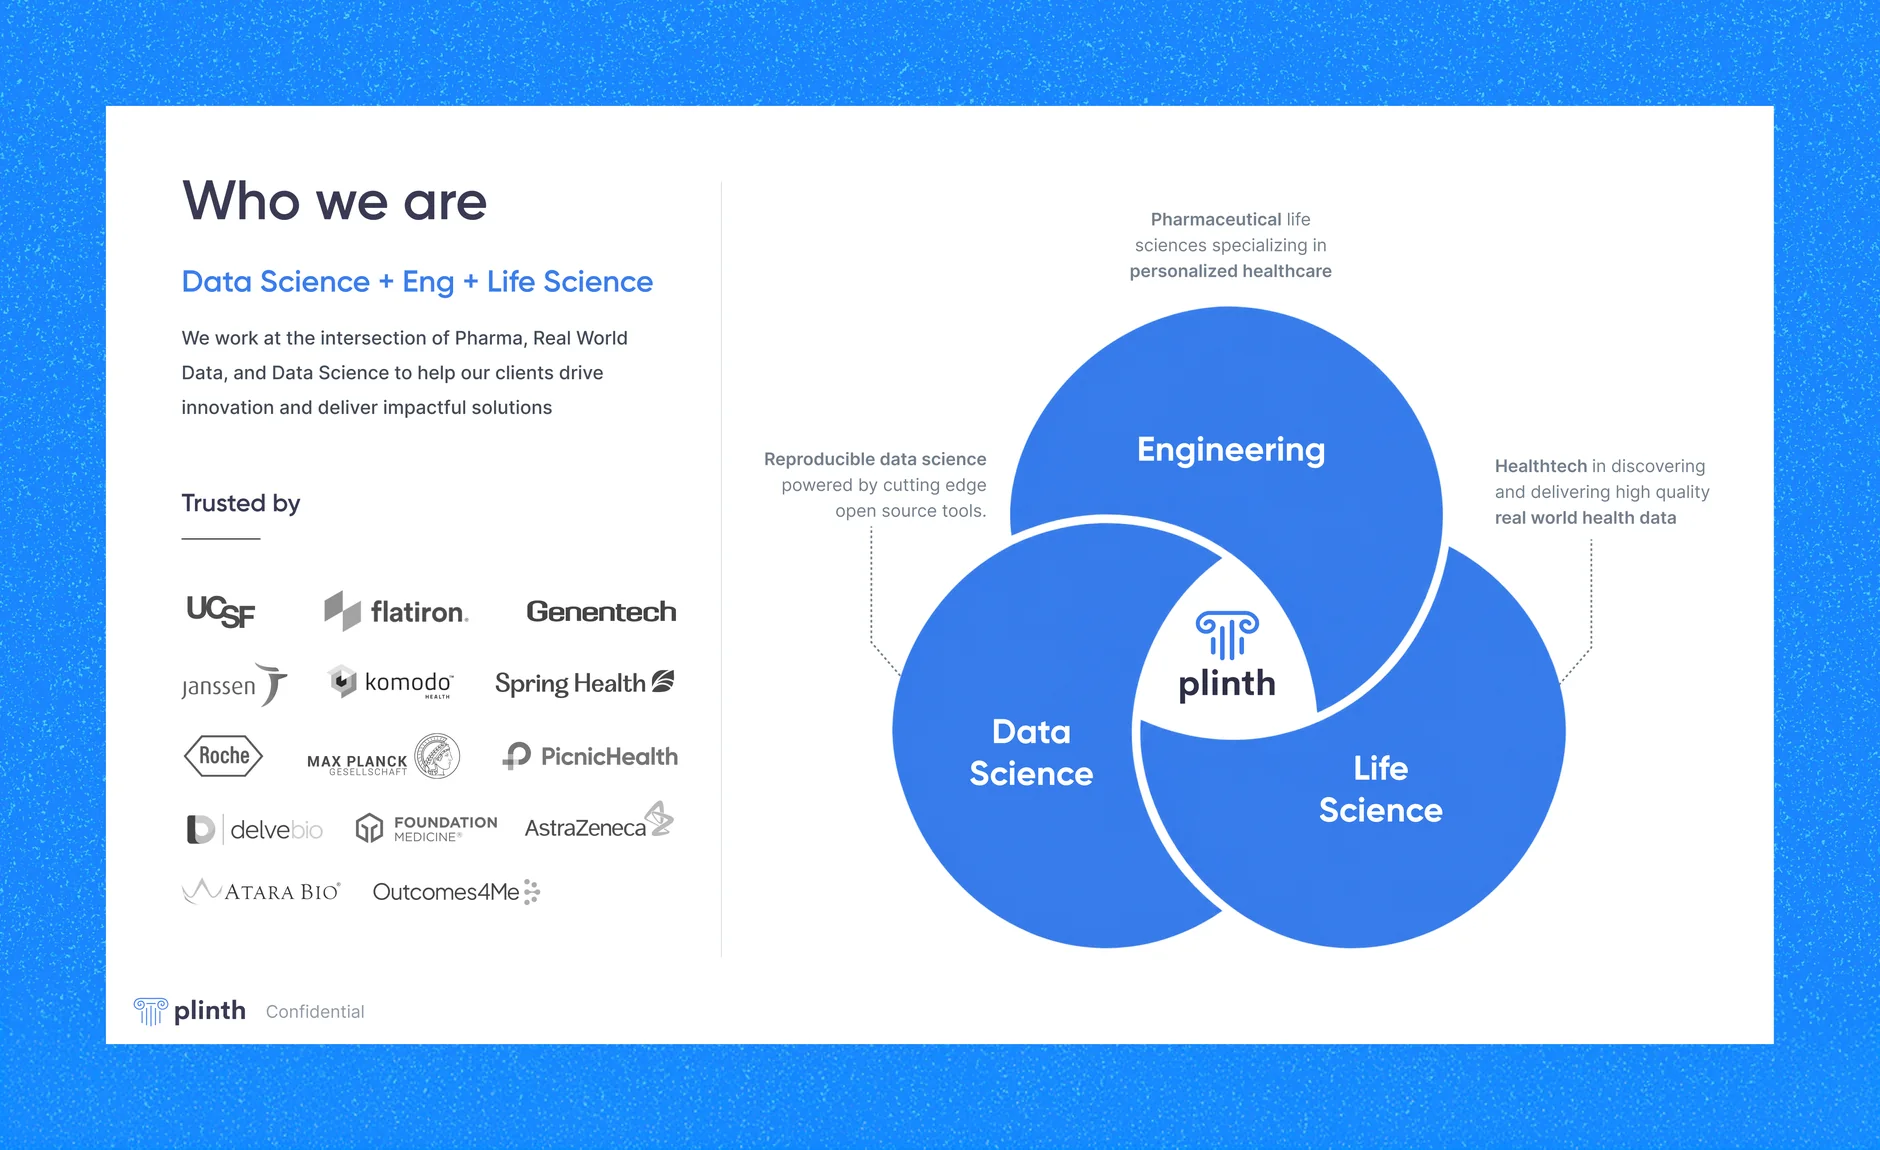
Few shops could bring data science, engineering and life science expertise to the same engagement. Making that combination central to its positioning gave Plinth a distinct identity, and a concise answer to what set it apart.
Value

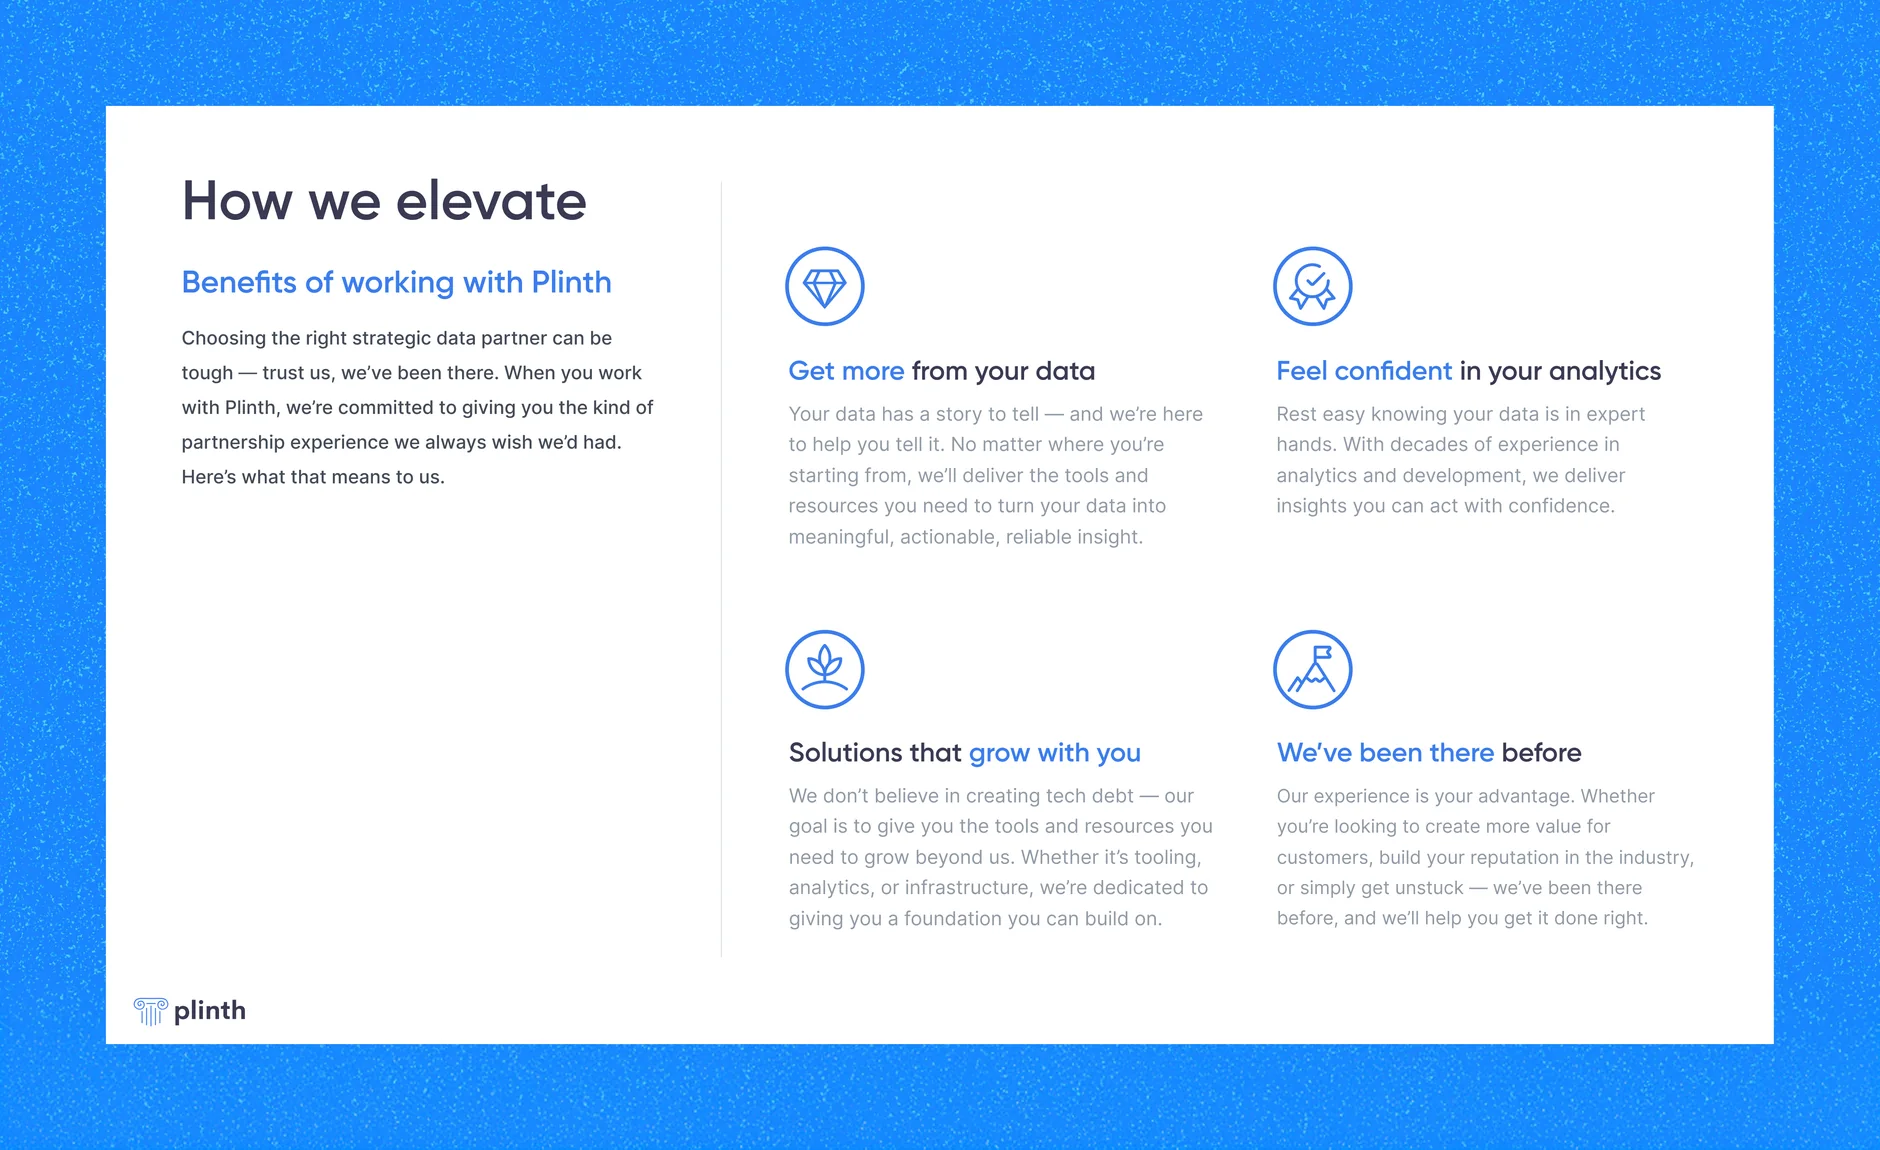
The four themes shared across both audiences became the foundation of Plinth’s value prop. Grounding its messaging in the needs, pains and goals articulated by prospects gave it a way to explain its value in terms both audiences would recognize.
Service models

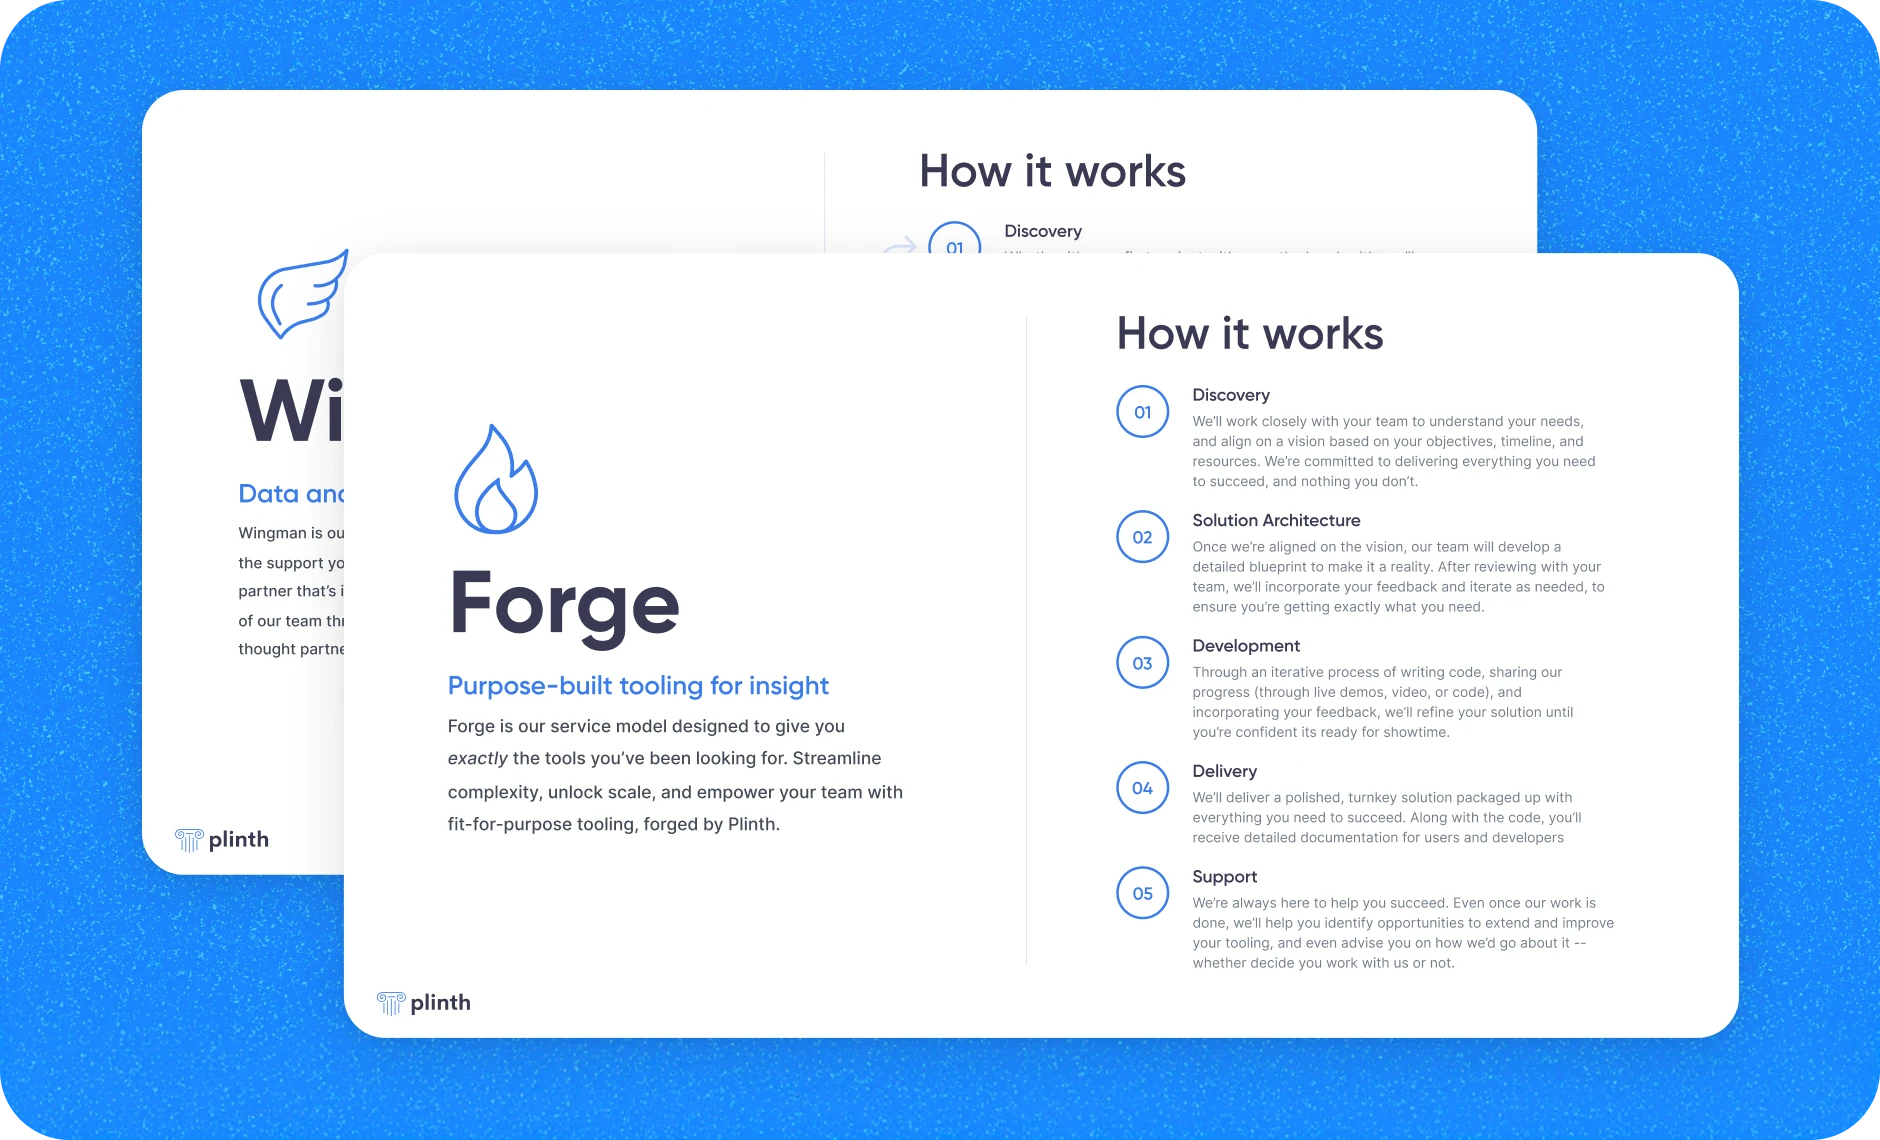
Two distinct service models, each with its own identity and promise, let Plinth meet prospects with a clear engagement structure rather than a blank slate. A clear roadmap for each made committing to bespoke work feel like a smaller leap.
Samples

Concrete examples helped ground the early conversations in something tangible and narrow the scope of the engagement more quickly. The team no longer had to shape every engagement from scratch.
Identity

Few shops could bring data science, engineering and life science expertise to the same engagement. Making that combination central to its positioning gave Plinth a distinct identity, and a concise answer to what set it apart.

The “Who we are” slide: a three-way Venn of Engineering, Data Science and Life Science, with Plinth at the center, beside the list of clients.

Value

The four themes shared across both audiences became the foundation of Plinth’s value prop. Grounding its messaging in the needs, pains and goals articulated by prospects gave it a way to explain its value in terms both audiences would recognize.

The “How we elevate” slide: four benefits of working with Plinth, each with a circled line icon and an accent-colored headline.

Service models

Two distinct service models, each with its own identity and promise, let Plinth meet prospects with a clear engagement structure rather than a blank slate. A clear roadmap for each made committing to bespoke work feel like a smaller leap.

Forge and Wingman “How it works” slides: discovery, solution architecture, development, delivery, support.

Samples

Concrete examples helped ground the early conversations in something tangible and narrow the scope of the engagement more quickly. The team no longer had to shape every engagement from scratch.

“What we can build” and “What we can do” slides listing example engagements.

System

Building on the voice and visual language we’d developed for the pitch, I turned those decisions into guidelines and a set of composable building blocks covering story, voice, type, color and reusable Figma layouts. With the guidelines and a toolkit to work with, the team has continued to extend the deck and create new materials of its own.

Plinth→ Typographyp. 08

Typography

Gilroy sets headlines with a warm, geometric character that keeps the deck approachable. Inter handles body copy, labels and data, staying legible at small sizes.

Gilroy SemiBoldHeadlineYour data has a story to tell.
Gilroy MediumSubheadWe help pharma and health-data teams turn complex real-world data into insight they can act on.
Inter RegularBody

Choosing the right data partner can be tough. Trust us, we’ve been there. When you work with Plinth, we’re committed to giving you the kind of partnership experience we always wish we’d had.

Inter SemiBoldLabelData science + Engineering + Life science
Plinth→ Layoutsp. 14

Layouts

Every slide starts from one of a small set of page layouts. Each defines where the title, supporting copy and visuals sit, so new pages stay consistent as the deck grows, whoever builds them. Start from the closest layout, then swap in content.

Text + image
Four-up
Section divider
Title + list
Card row
Q&A
Plinth→ Colorp. 06

Color

Our color system is roughly 60% white and neutrals, 30% Plinth blue and 10% supporting tones. Plinth blue is the brand's signature, marking highlights, links and key moments. Neutrals carry text, surfaces and dividers so the blue can do its job.

Plinth blue

Highlights, links and brand moments.

100#D5E3FB
300#7CA8F3
500#3B7DED
700#0F48A8
900#082454
Neutral

Text, page backgrounds and dividers.

0#FFFFFF
100#EBEEF3
300#C3C9D4
500#737F8C
900#2E2F45
Plinth→ Voicep. 04

Brand voice

Plinth sounds like the expert colleague you're glad to have on the call. These four traits keep the deck, the website and every proposal sounding like the same team.

Expertise, made clear

We know the science and the systems inside out, and we explain them in plain words. If a prospect needs a glossary to follow us, we've lost them. We'd rather show what the data can do than describe how clever the method is.

On your side

We've been in our clients' seats, on both sides of the data. We write like a partner who has their back: we, not the vendor; you, not the customer. Every message should leave them feeling less alone with a hard problem.

Straight to the point

Short sentences, real answers, honest trade-offs. We say what we'll build, what it costs in time, and what we don't do. Nothing you don't need, and nothing hidden in the fine print.

Serious work, lightly worn

The work is rigorous; the tone doesn't have to be stiff. A well-placed bit of wit makes a technical offer human and memorable. Used sparingly, it's a signature. Used everywhere, it's noise.

Plinth→ Brand storyp. 03

Brand story

Plinth sits where data science, engineering and life science meet. The story covers who we are, what we believe and how we work, so everyone tells it the same way.

Who we are

A team of data scientists, engineers and life scientists who have worked on both sides of real-world data: producing it, and putting it to work in pharma research.

What we believe

Good data deserves to be used well. The best partners leave you more capable than they found you, with tools you own and no tech debt to inherit.

How we work

Alongside your team, from discovery to delivery. Open-source by default, documented as we go, and built to grow beyond us.

2026

Evolving the system

Challenge

Three years on, Plinth’s business had consolidated around building. Most of its work was now bespoke solutions, each developed around a client’s own data and systems. Plinth approached me to bring its go-to-market in line with that shift, refining the system we’d built in 2023 and extending it into a new suite of sales collateral. As the team shipped more software, it also needed a design system it could rely on without a designer on staff.

Those builds tended to follow recognizable archetypes, and an example of each gave the team something concrete to put in front of prospects. Each one had to feel real enough to picture in a prospect’s own organization, while making clear that anything Plinth delivered would be built new, around their timeline, budget and stack. Lean too far in either direction and the materials would be misread:

Too much like a product

  • Reads as off-the-shelf software
  • Hides that each build is made new

Too much like a case study

  • Reads as another client’s project
  • Leaves a prospect little to picture

Design

Plinth needed to be specific about what it builds without any of it reading as a product for sale. To find a model, I looked at how architecture firms and cloud providers sell work that doesn’t exist yet, and help clients envision the end result. From there I proposed framing each of Plinth’s builds as a blueprint, a system it had built before and could build again around a new client’s needs. I designed the format to carry that framing. The structure of the page makes clear what kind of document it is, so the copy can speak confidently about what each build does.

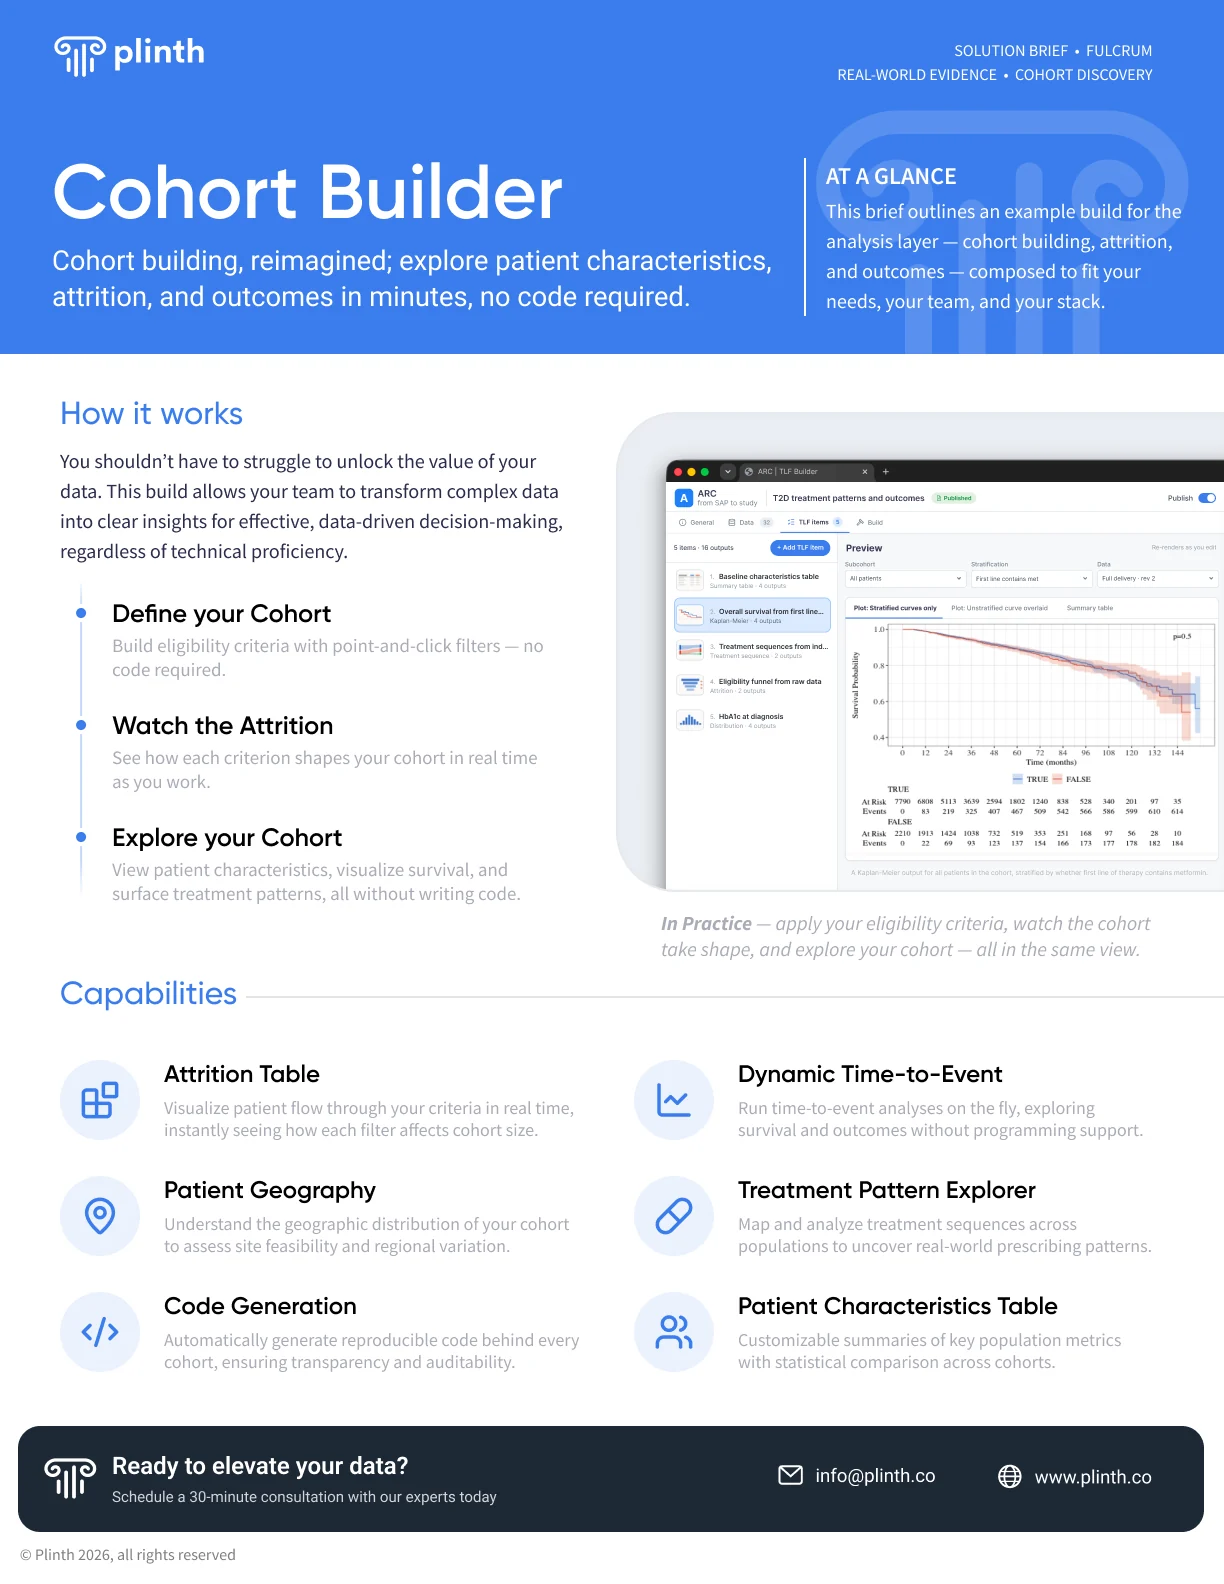
That strategy first took shape in a set of solution briefs, built around Plinth’s flagship builds as the start of a larger library.

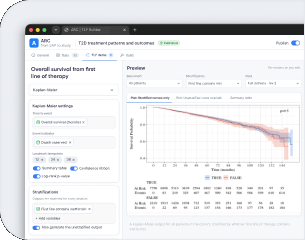
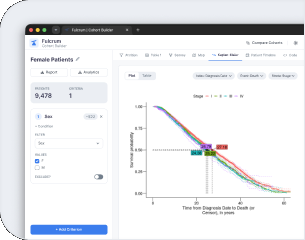
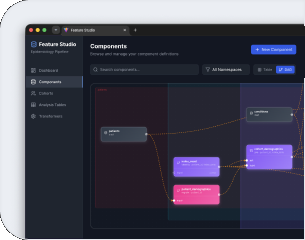
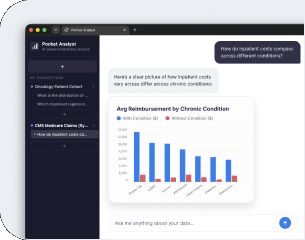
Cohort Builder solution brief12
1In practice

Each build brings its own vignette, shown in use and captioned as an example.

Reporting
Analysis
Data engineering
Investigation
2Capabilities

Drawn from a shared set of capability blocks and arranged two-up.

Attrition TableVisualize patient flow through your criteria in real time.

Feature RegistryReusable, versioned definitions shared across studies.

Chronic Condition InsightsCompare costs and outcomes across conditions.

Grain-Aware ValidationCatch joins at the wrong level before they ship.

Working closely with the Plinth team, I drew out the substance of each build and distilled it into a clear case a prospect could take in at a glance. The initial set was designed to grow. As new builds take shape, the team can add a brief for each, giving prospects a wider range of blueprints in which to find their own problem.

System

Plinth’s product builds needed the same consistency as its sales materials, with no designer on staff to maintain it. I extended the visual language of the briefs into a full design system of tokens, components and a DESIGN.md, built for the team’s agentic workflow. New UI starts on-system by default, which keeps each build consistent as the catalog grows, without design becoming a bottleneck.

PrimarySecondaryGhostButtonButtonButtonButtonButtonButtonButtonButtonButtonButtonButtonButton
Overall survivalKaplan-Meier · by stagePlotTable
1.000.750.500.250024487296120144Months from first lineI–IIIII–IV
24 months
Stage I–II0.88
Stage III–IV0.81
Survival
Summary
Sequence
Attrition
Distribution
Button•••
Sizemd
StateDefault
LabelButton
Icon left
Icon right
IconsLucide
Display
Gilroy 600 32 / 36
Heading
Gilroy 600 20 / 26
Body
Inter 400 14 / 20
Label
Inter 600 11 · caps
TOKENHEXROLE
accent#3B7DEDActions, selection
accent-tint#DBEAFESelected rows
ink#3A3A53Primary text
ink-muted#737F8CSecondary text
border#D7DCE7Dividers, inputs
chart-2#E0645AComparison series
metfor
Metformin
Metformin XR
Metformin + sitagl…

Create variable
DESIGN.md
# DESIGN.md · Plinth
Tokens and components for Plinth products.
## Color
accent: #3B7DED # blue/500
accent-tint: #DBEAFE # blue/100
ink: #3A3A53 # text/default
ink-muted: #737F8C
border: #D7DCE7
panel: #F7F8FA
## Type
display: Gilroy 600 · 32/36
heading: Gilroy 600 · 20/26
body: Inter 400 · 14/20
label: Inter 600 · 11/14 · caps
## Radius sm 4 · md 8 · lg 12 · pill 999
## Components
### Button variants: primary, secondary, ghost
states: default, hover, pressed, disabled
height: 34 · padding: 0 14 · radius: md
### Tabs icon + label + count · active: 2px accent

What began as a sales deck now covers Plinth’s sales materials and the products it ships, and the team runs it on its own. The next set of briefs is already under way.

We’ve been sending these out left and right. I’m already working on the next batch of pages for our upcoming demos.
Sadie HarrisonChief of Staff, Plinth Analytics

Logo refresh

Alongside the briefs and the design system, I took the opportunity to refine Plinth’s logo, building on a brand story that was already strong. The image of a pedestal, built to elevate and frame what rests on it, is a natural fit for a company that finds the story in raw, messy data, and I wanted the mark to tell that story more clearly while keeping the column at the heart of it.

The refreshed Plinth logo with the tagline, your data, elevated
The 2023 Plinth logo2023
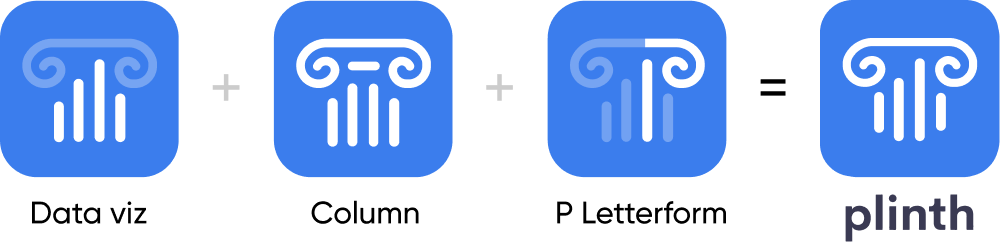
Data viz, a column and a P letterform combine into the Plinth mark.

Plinth’s move into product also raised the bar for the mark. It now had to hold up everywhere from a favicon to a cover slide, and to sit comfortably beside the established vendors its prospects already work with. Simplifying the form let it read cleanly at any size, while the column’s shafts, doubling as the bars of a chart, bring the data into the symbol itself. Together those changes give Plinth a mark that tells its story as clearly in a browser tab as on a conference stage.

Impact

Across three years and two separate engagements, our collaboration has given Plinth a clearer offering and a repeatable sales motion, helping the business close more deals, faster, with less dependence on the founders. Today the team continues to build on that foundation, with a clearer way to bring new offerings to market and a shared design system that helps it maintain quality and consistency across every product it ships.

2×
quarterly deal volume

Within six months of delivery, Plinth was closing twice as many deals per quarter.

−40%
time to close

Average time from first touch to signed deal fell from about five weeks to three.

turnkey sales motion

A shared set of materials and playbooks removed the founders as a bottleneck, freeing them to focus on delivery.

The materials Stu delivered were an immediate game-changer for our sales motion. The deck started converting from day one — and once we actually knew what we were selling, our deals started closing about 40% faster. Three years later, the branding and product framework Stu built is still the foundation of how we go to market.
Kieran Mace, PhDFounder & CEO, Plinth Analytics

See also

All projects