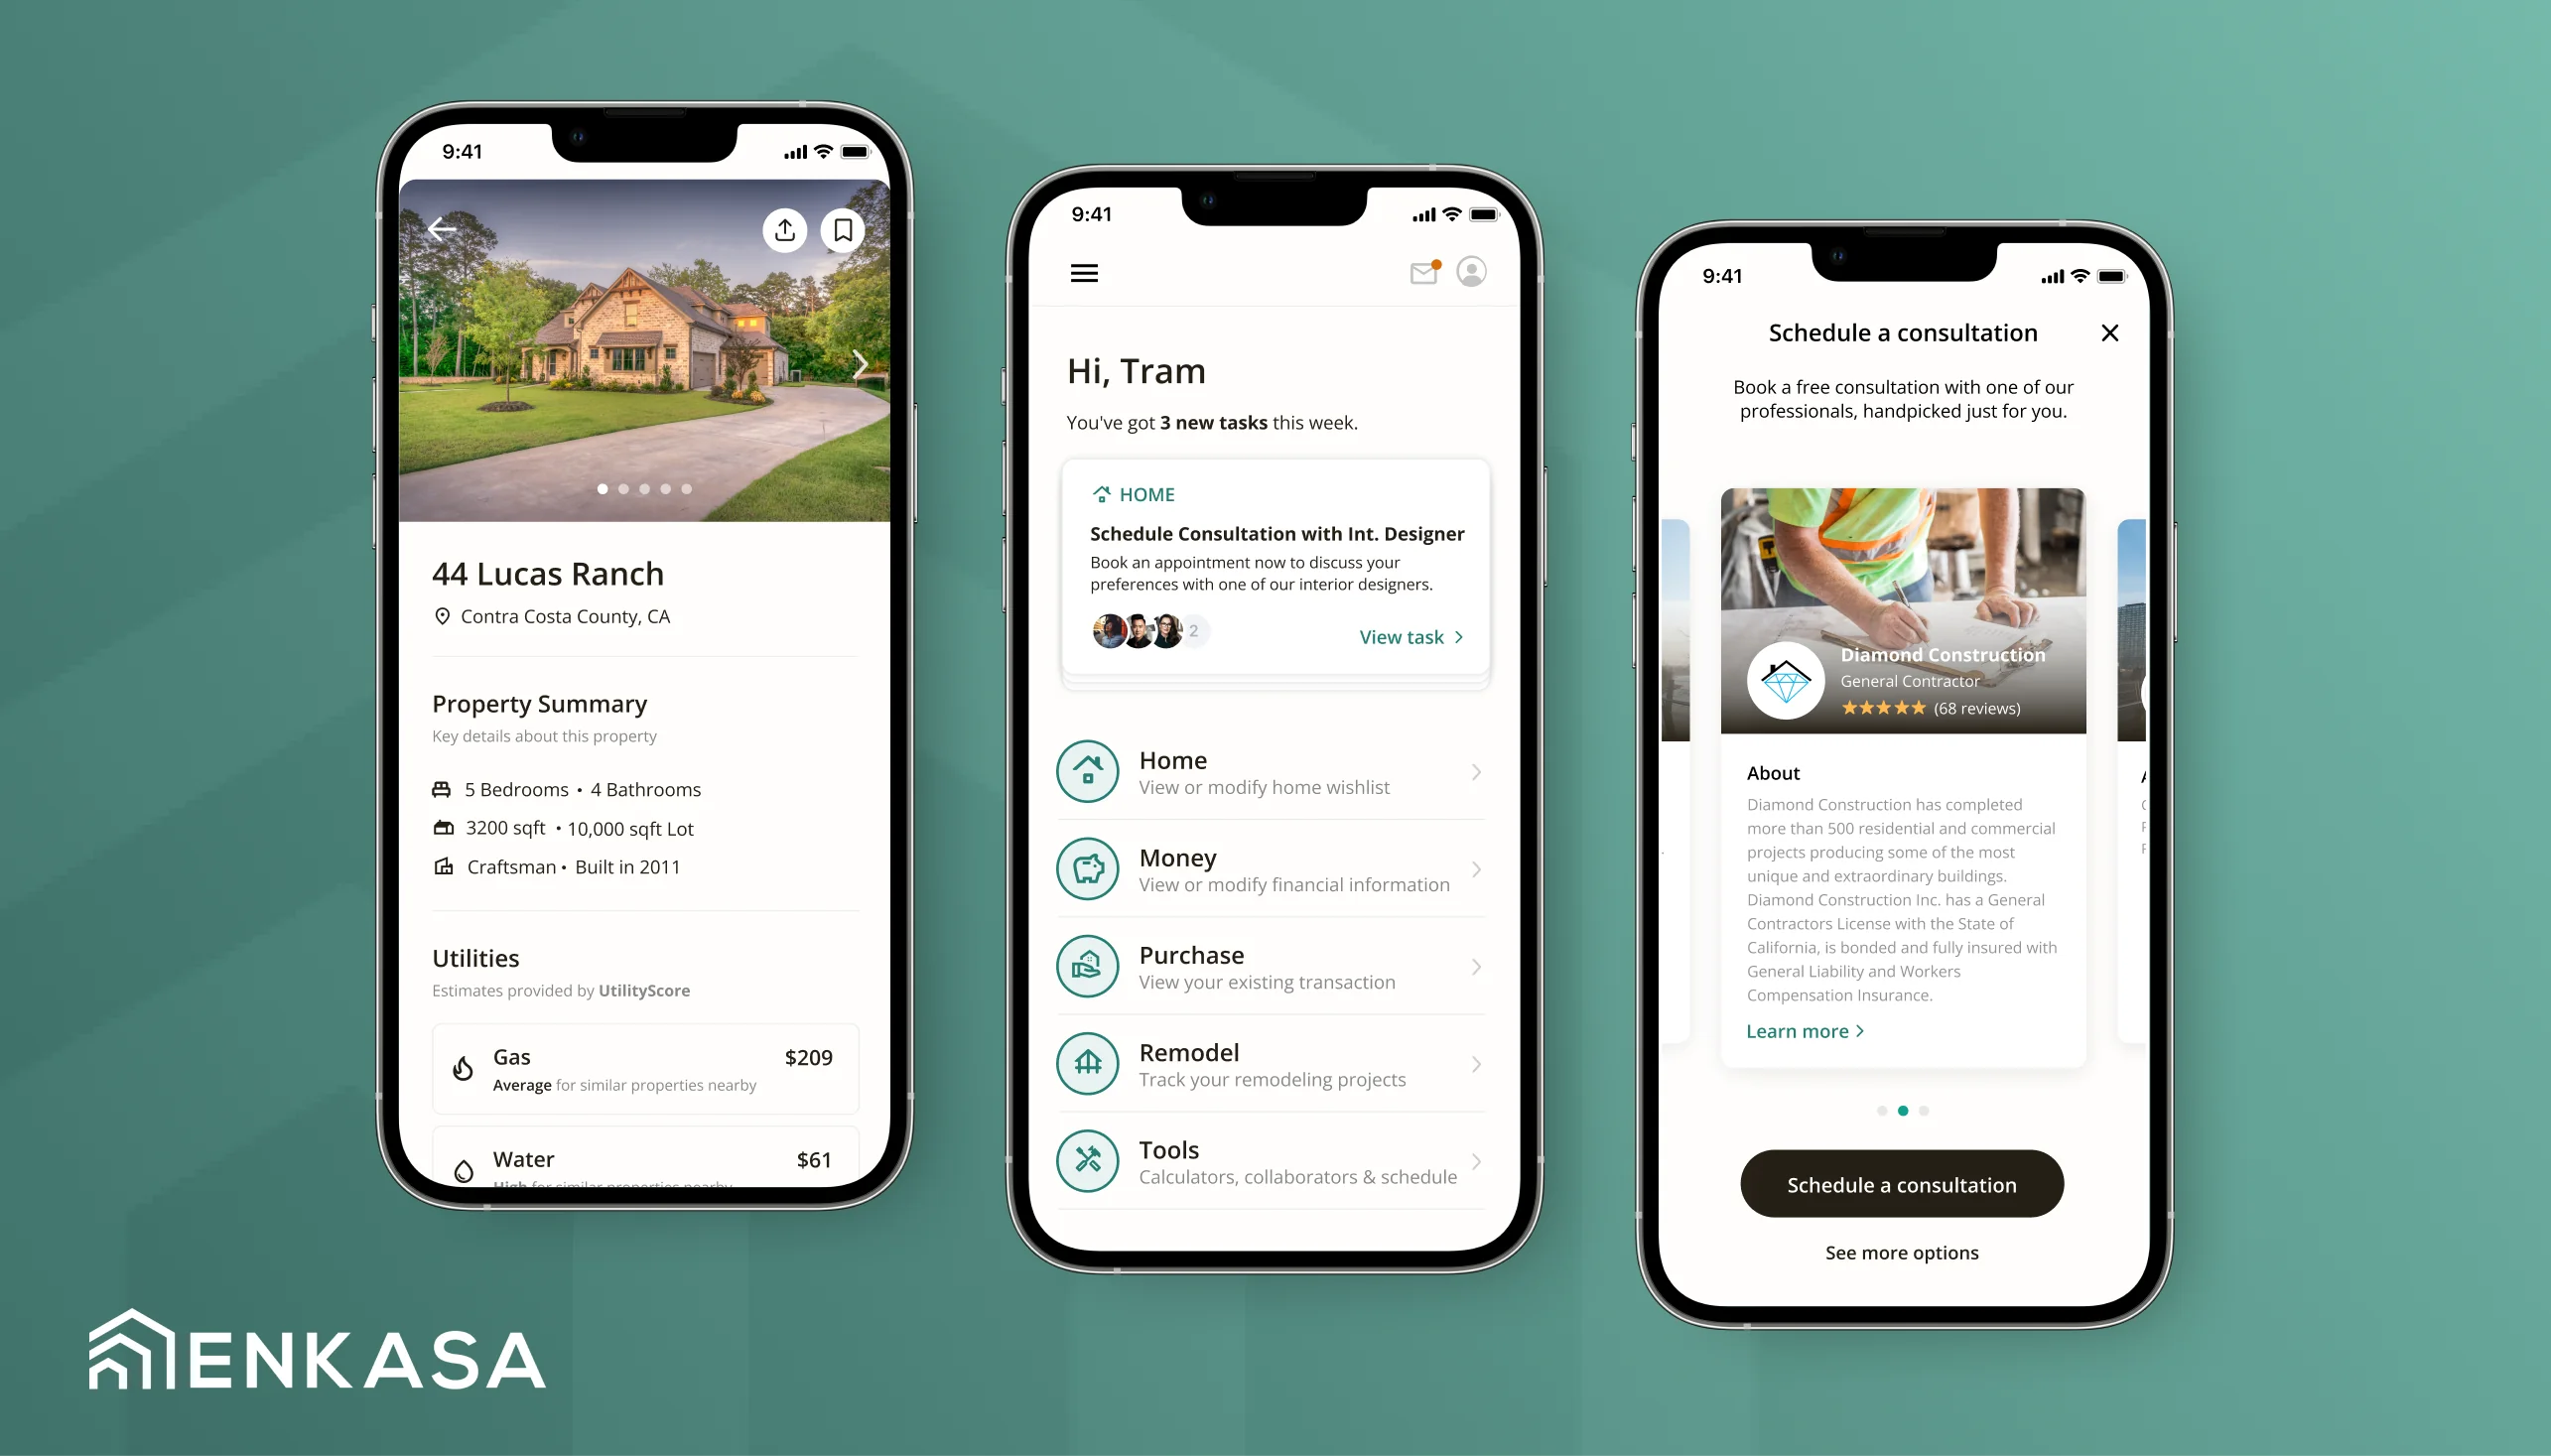
 Enkasa
As first designer, oversaw foundational user research and conceptual design for Enkasa's integrated real estate & remodeling platform, culminating in a $3M seed.
 Stu McGibbonSan Francisco, CA
 PicnicHealth
Led design for PicnicHealth's patient survey platform, including user research, product strategy, producing interaction and visual designs, and prototyping.
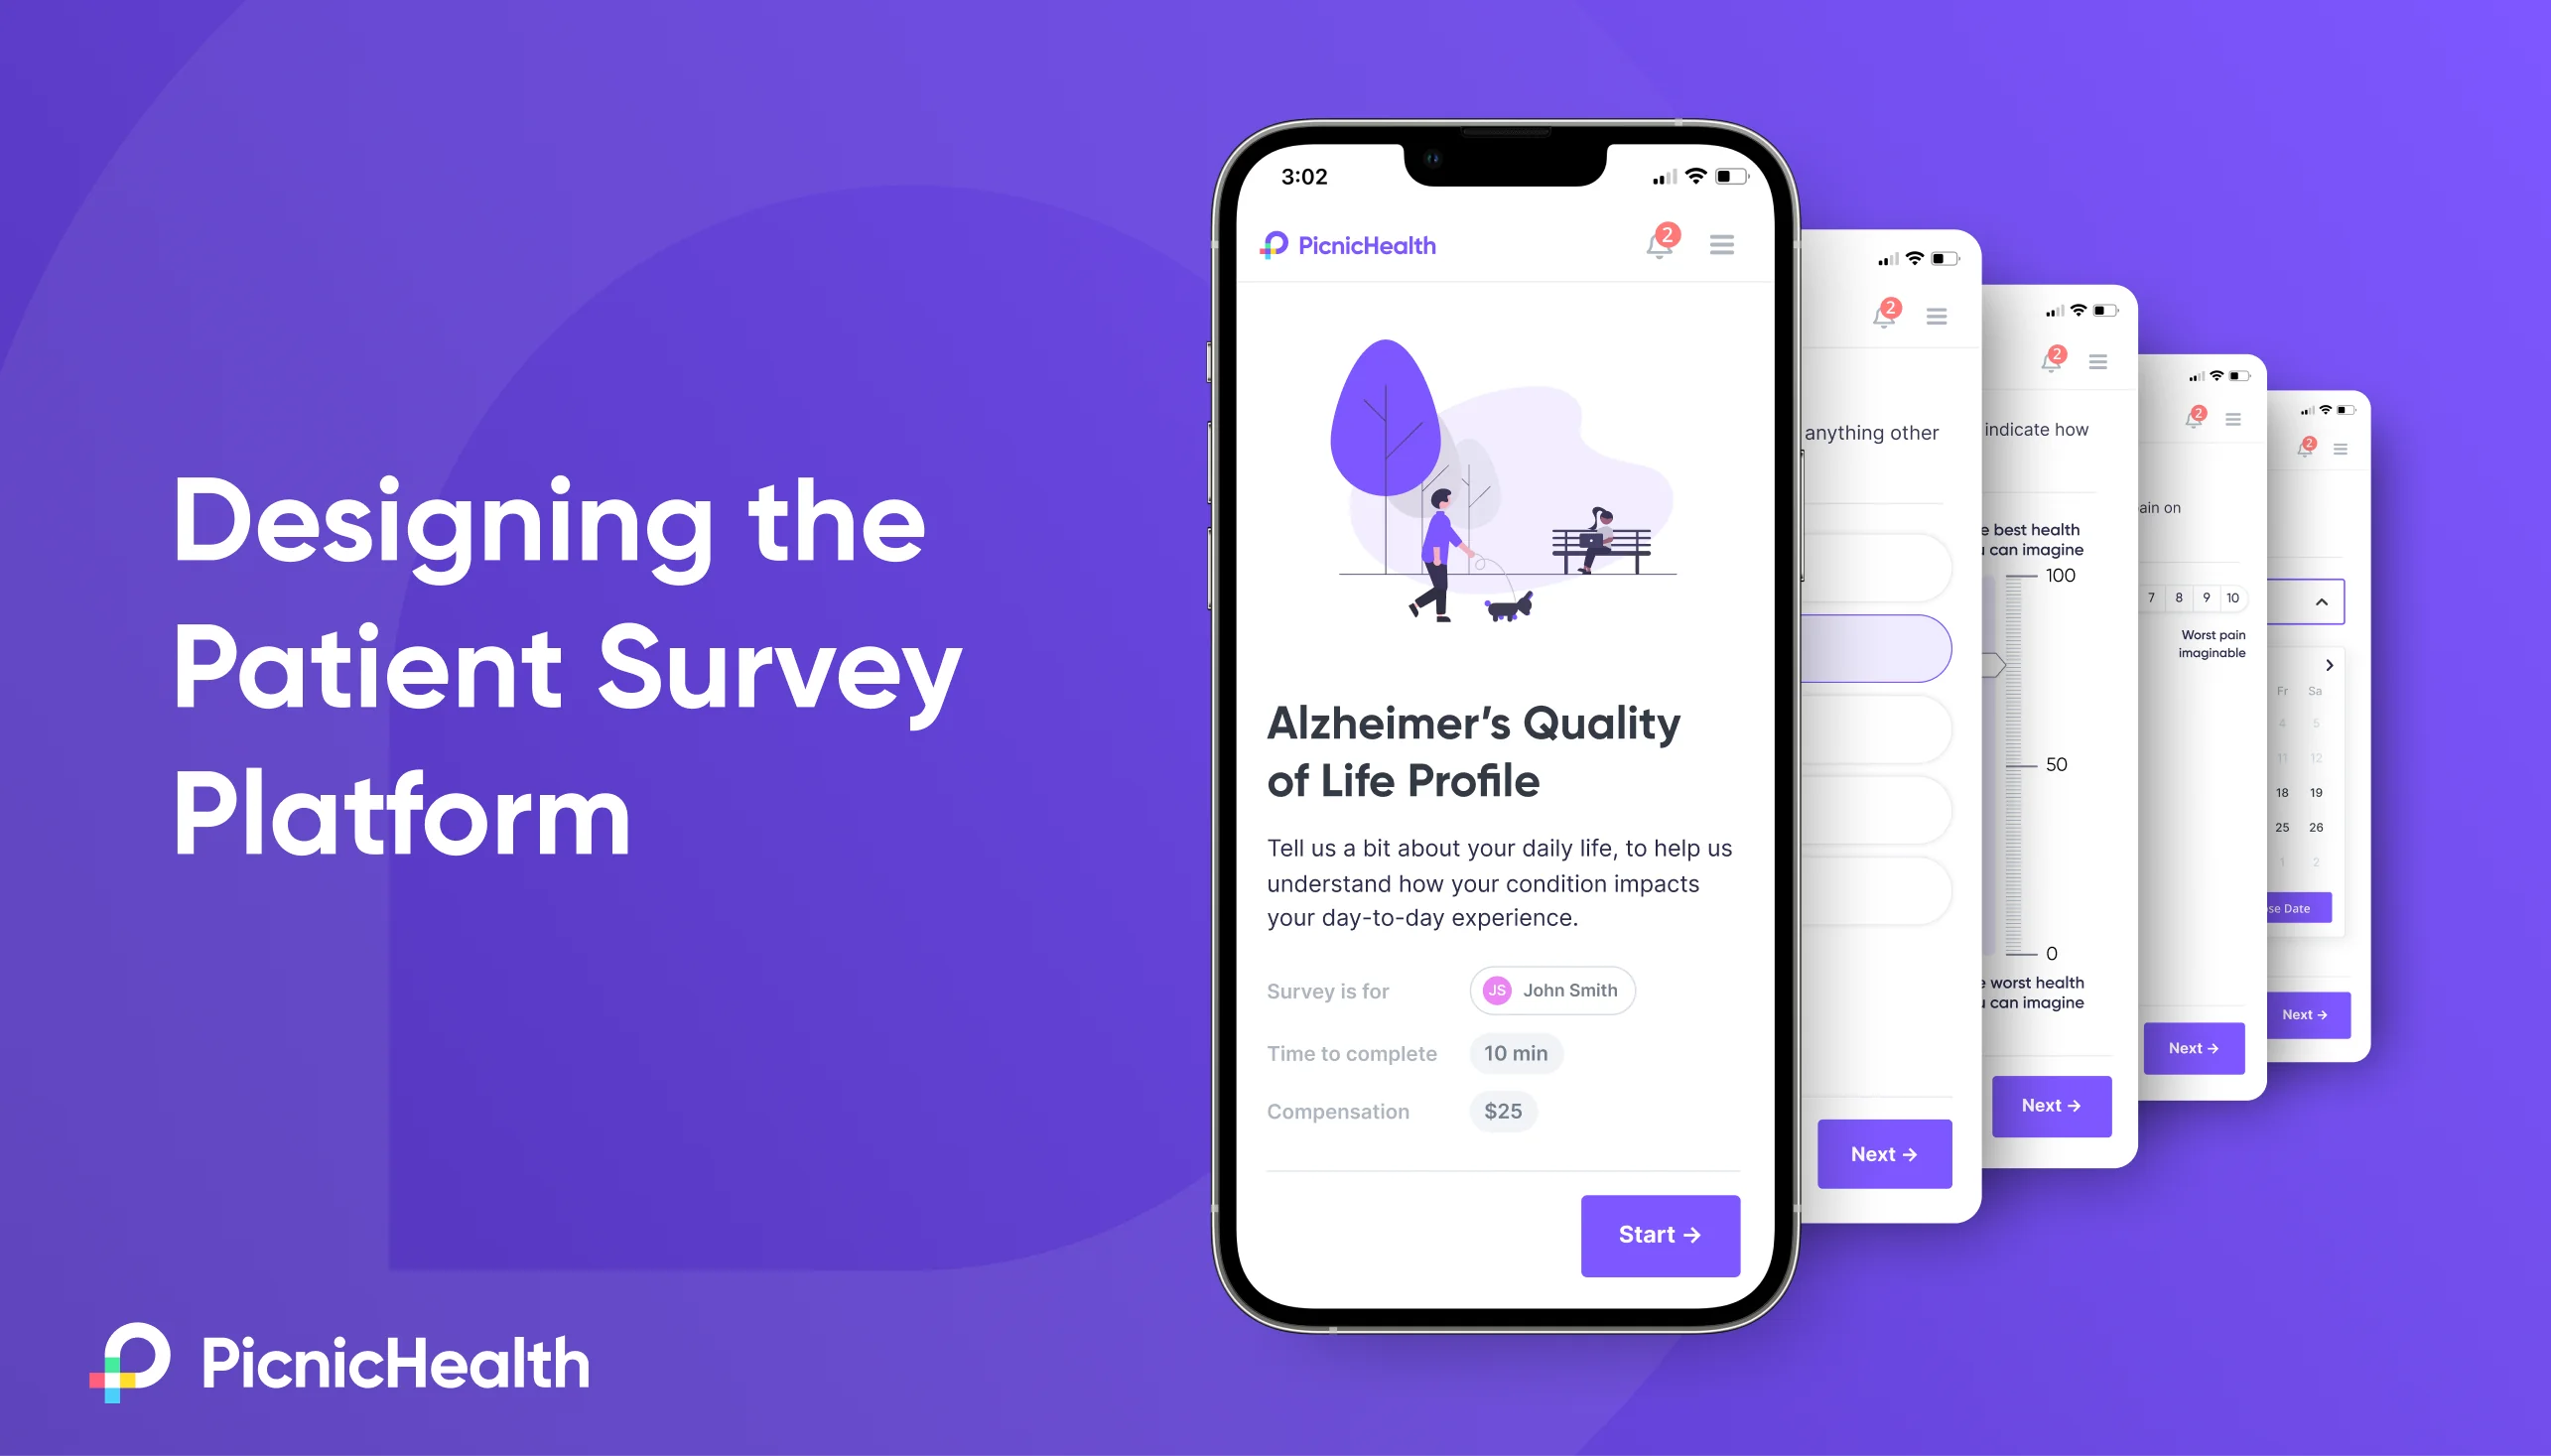
Founded in 2014, PicnicHealth is a digital health company that works directly with patients to collect, structure, and analyze medical records for Life Sciences research. In 2022, PicnicHealth was looking to expand their footprint by launching “Patient Reported Outcomes” surveys (PROs). These are clinical surveys completed by patients on a recurring basis, that enable researchers to understand aspects of a patient’s experience that may change over time, and aren’t typically captured in medical records. Things like symptom severity, mental and emotional wellbeing, or satisfaction with their treatment.
My team was tapped to lead zero-to-one development of the brand new patient survey platform – an offering that would go on to be the company’s most successful new product launch ever. Here’s how we did it.
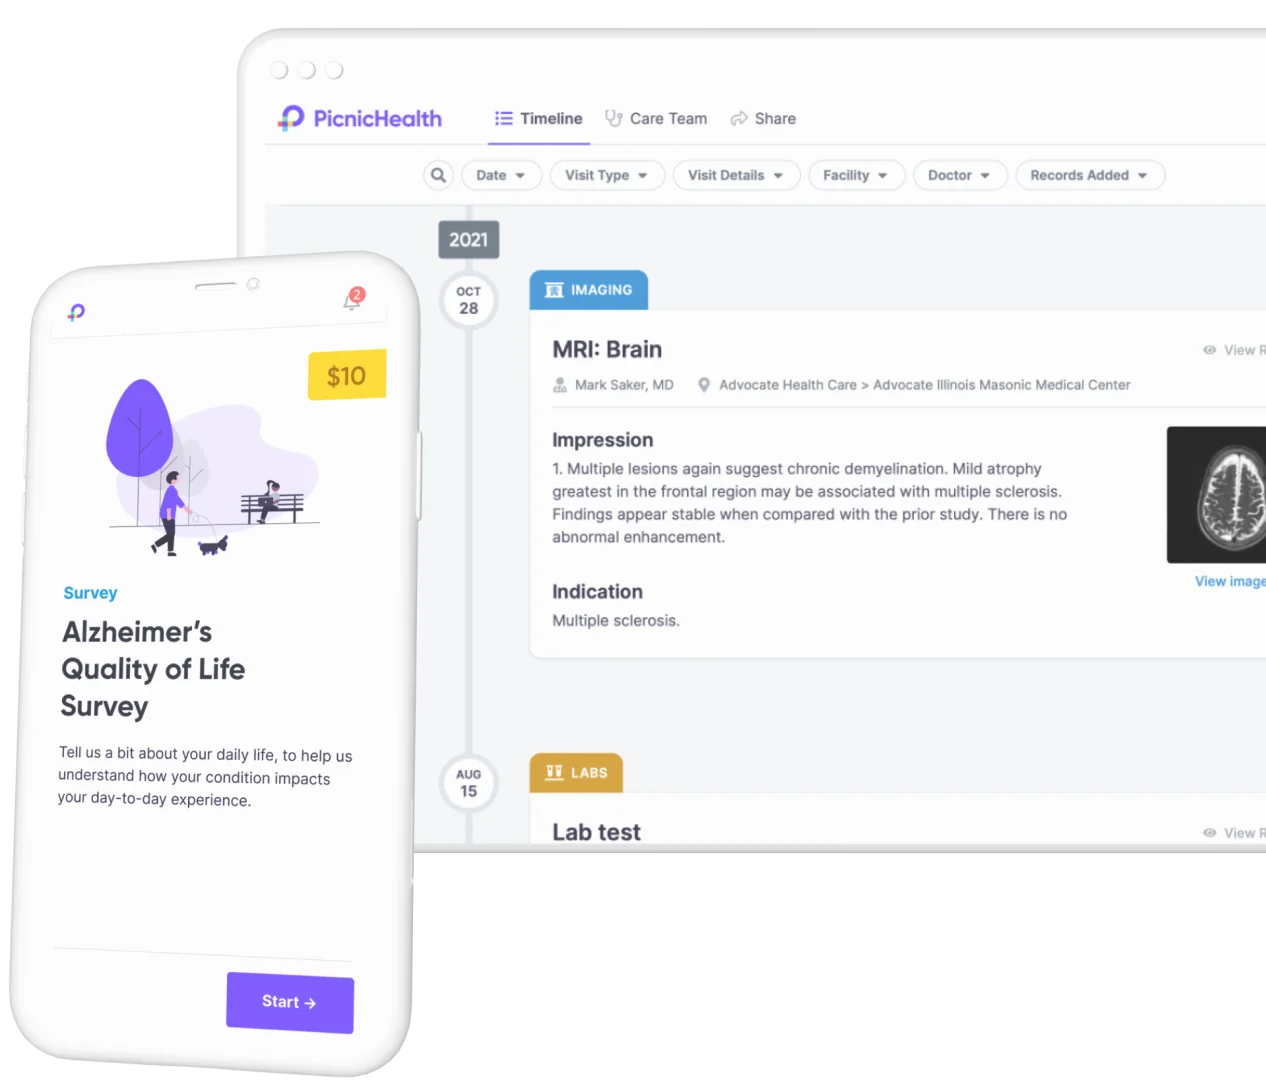
But hold on... if PROs are such a valuable tool for Life Sciences research, why weren’t we offering them from the start? As we discovered early on, there are a number of constraints that make PROs exceptionally difficult to get right:
Before a single survey could be delivered to patients, every aspect of the UX would be subject to scrutiny for adherence to clinical standards.
Every aspect of the platform – the UI, interaction design, and even notifications – would need to be designed with these constraints in mind, down to the pixel.
We’d need patients to complete surveys consistently week-over-week, month-over-month. Even one missed survey out of dozens can render a patient’s PRO data unusable.
Since these surveys can be long, repetitive, and frankly a bit boring, keeping users engaged over time would be a focal point of our design process.
PicnicHealth needed a solution that would enable us to configure hundreds of distinct clinically validated surveys – each with its own standards, questions, cadence, and target audience.
To be successful in executing PROs at scale, we knew that we would need a robust, flexible system of components and tools for customization.
Since PicnicHealth was already working with patients across dozens of rare diseases, we were well positioned to engage with patients directly to learn more about their day-to-day experience – something that can be very challenging for researchers to do on their own.
With overwhelming demand from customers, at a time when growth was critical to the company’s future, we knew the time was right to take on PROs.
Working with a fantastic PM counterpart, our first step was to organize our efforts for the coming quarters. Working closely with company leadership, clinical and commercial stakeholders, we identified the following KPIs, and set benchmarks we would need to hit for a successful launch:
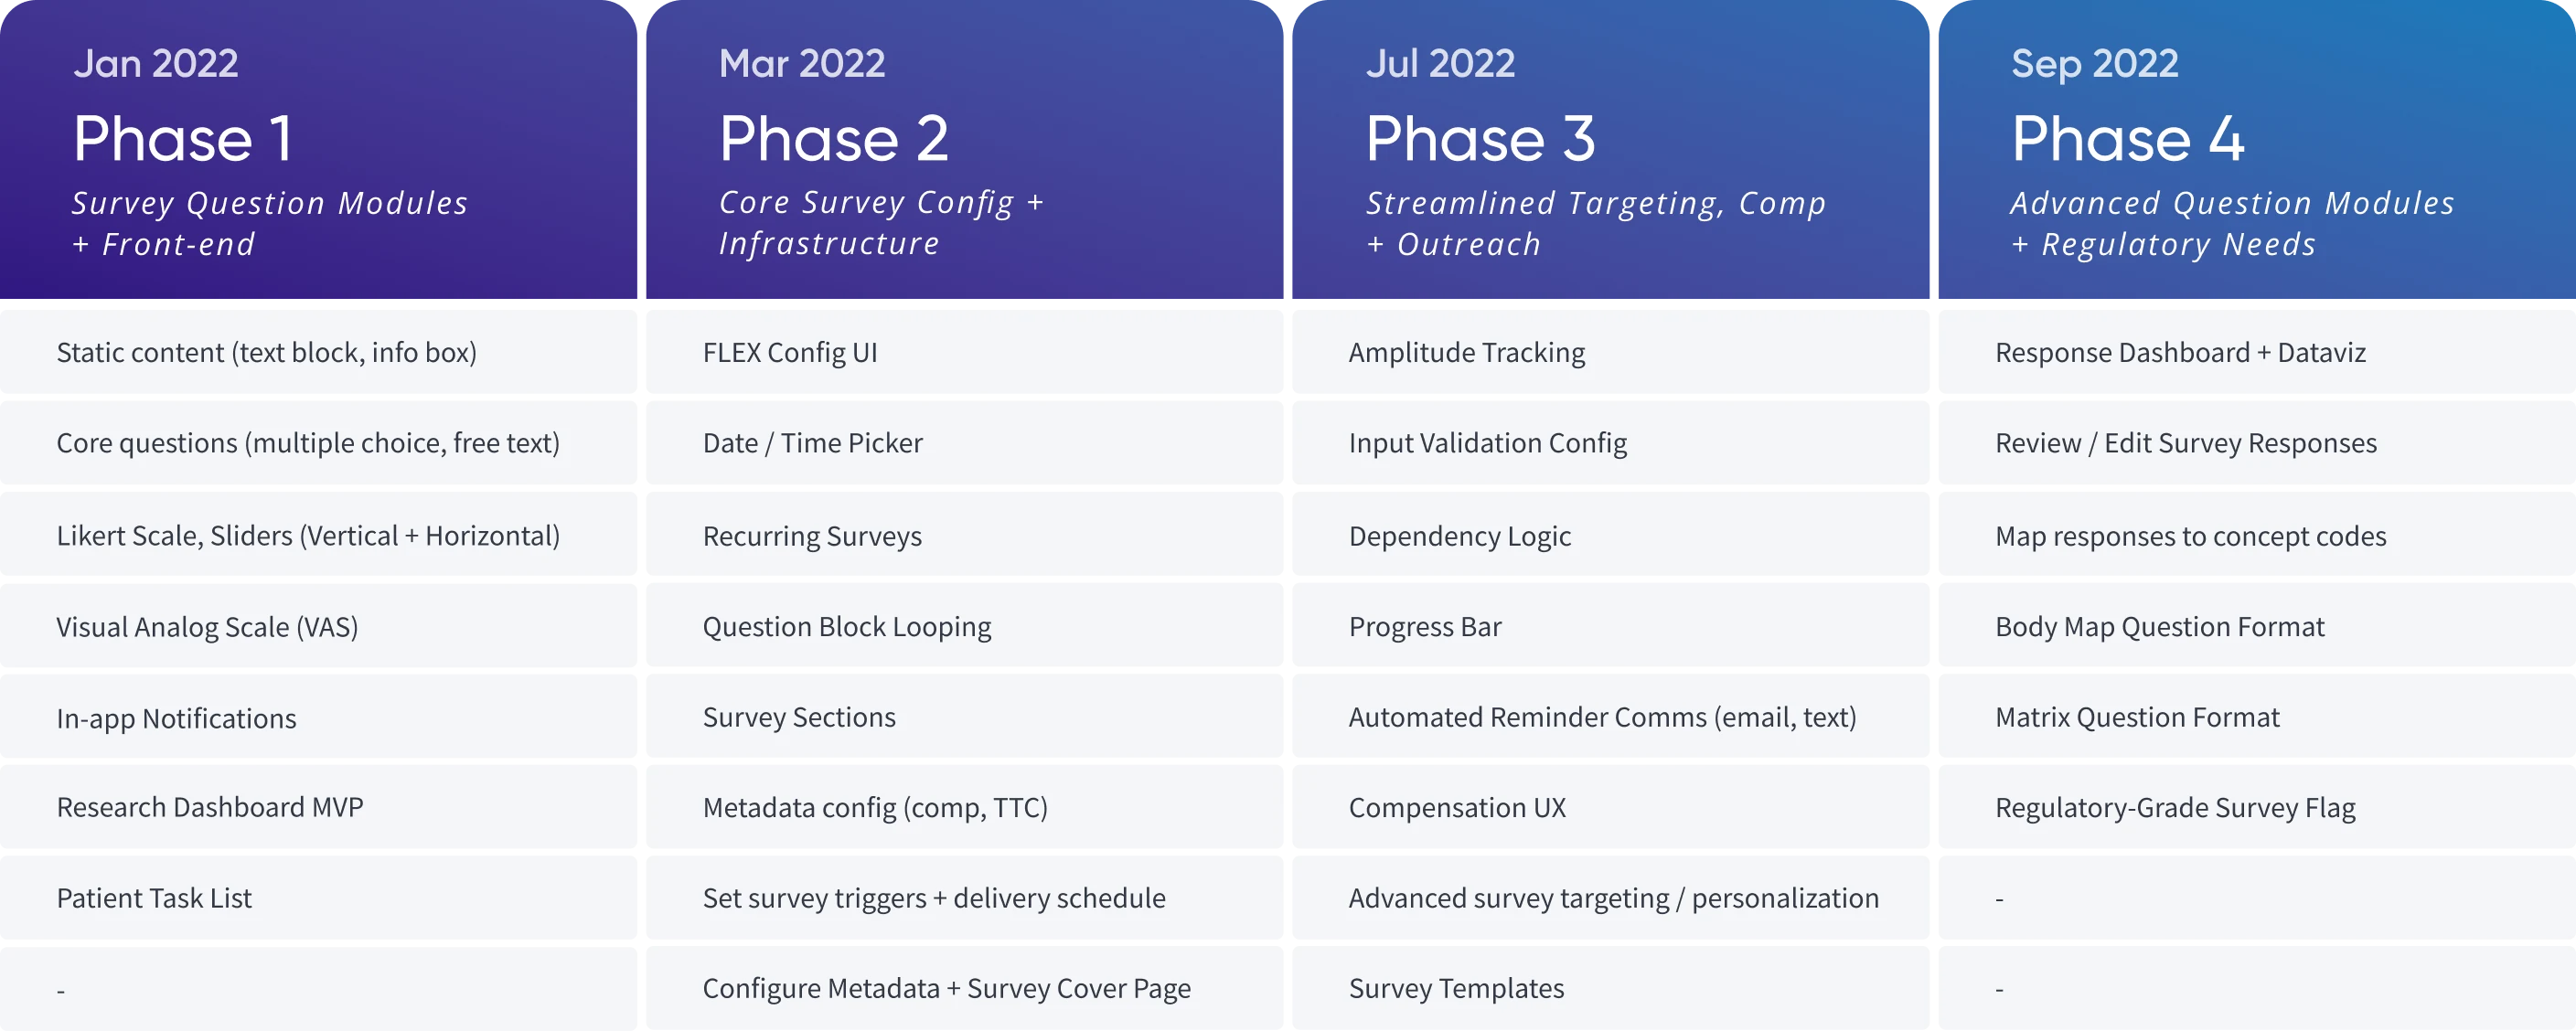
From there, we partnered with engineering to identify critical dependencies, scope our efforts, and prioritize ruthlessly until we arrived at a workable roadmap for the coming months. We summarized the output of these exercises into a roadmap covering 4 main phases of development:
In parallel with our planning efforts, I led the design team in kicking off a round of discovery to inform our design strategy, with a particular focus on activation and engagement.
Since keeping patients engaged, potentially over dozens of weekly surveys, was critical to a successful launch, much of our early discovery work focused on understanding what motivations drove our users to participate in research efforts, and how those factors evolved over time.
Given this product would be launched to over a dozen unique patient populations, we structured our research process compare these motivating factors across representative user groups. Here’s what we learned.
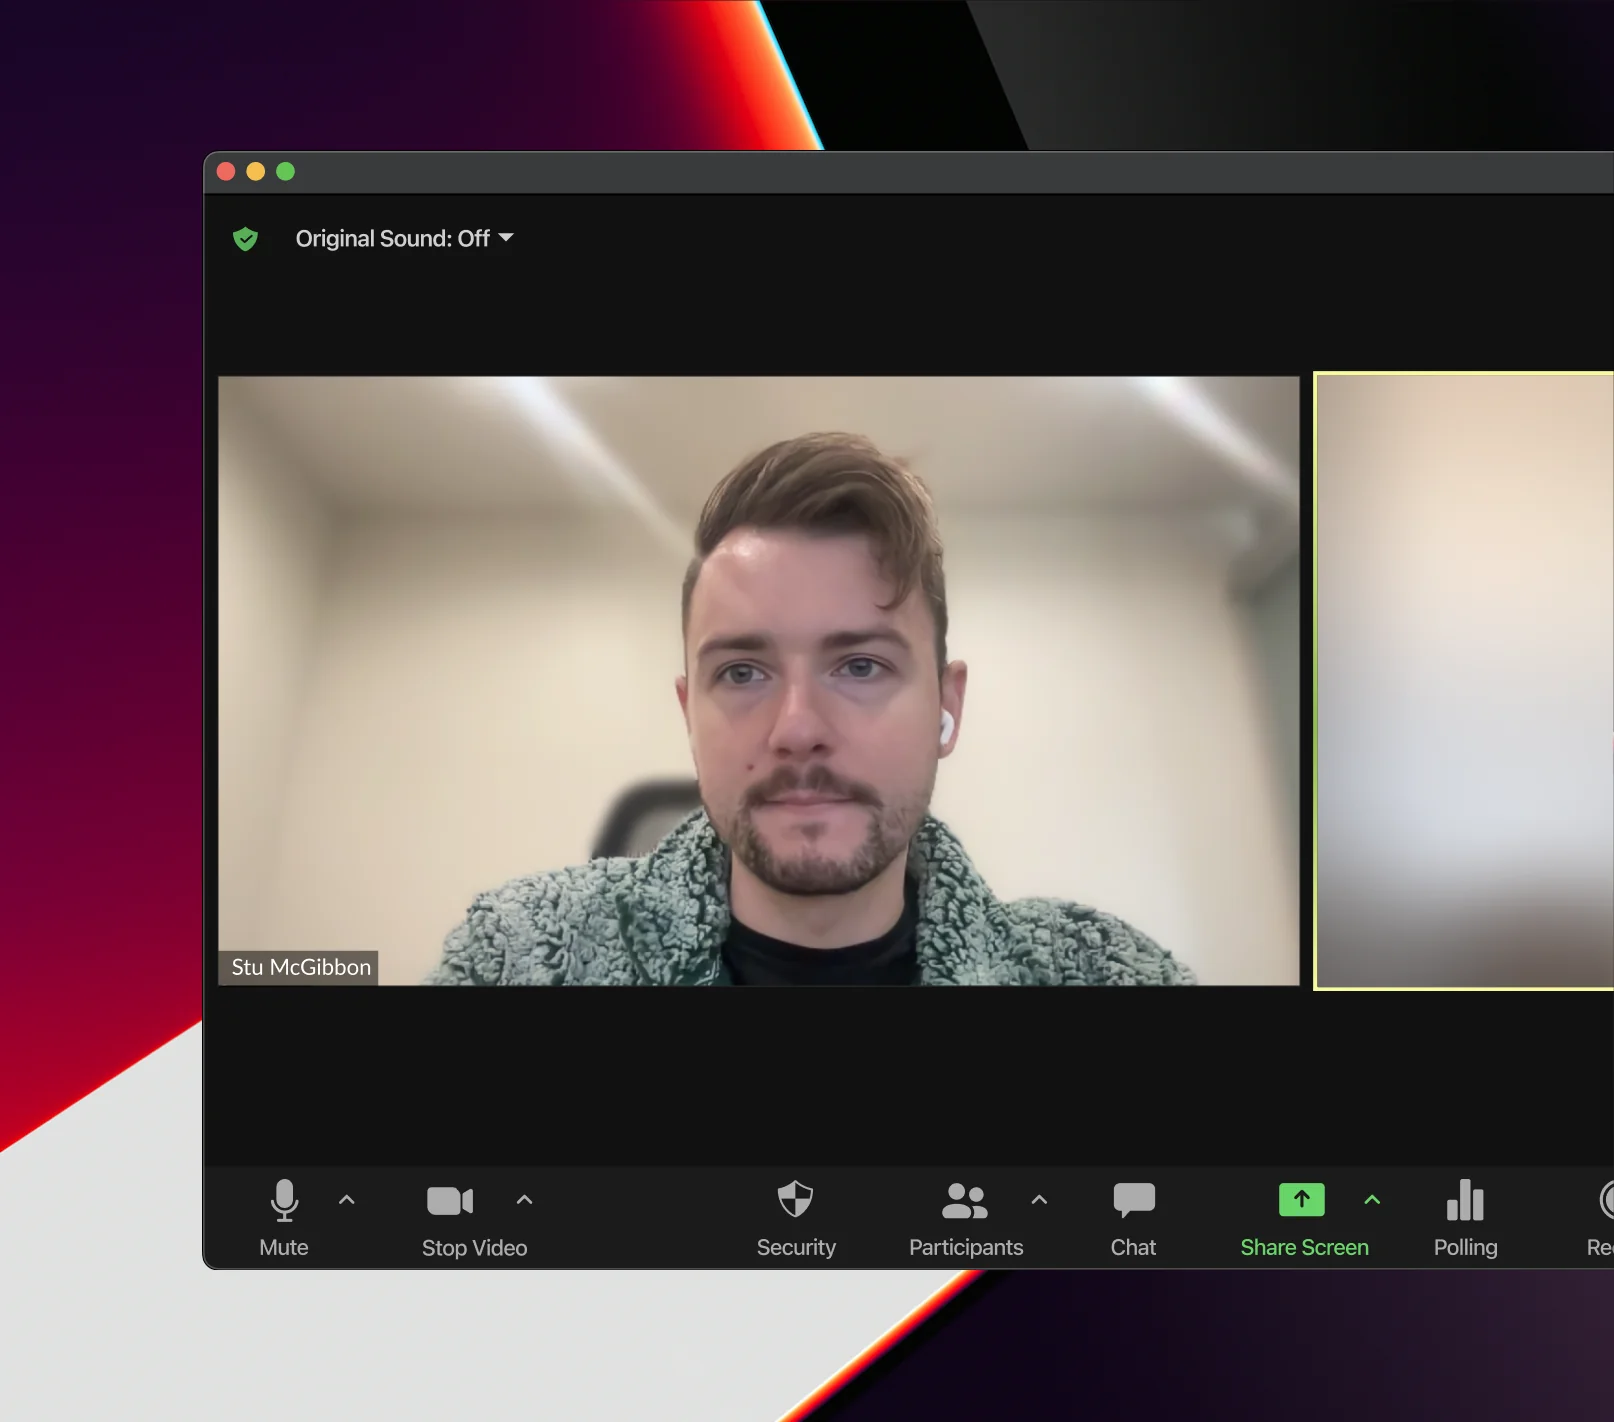

Many patients indicated they would be motivated to participate if they, too, could learn and benefit from their data.
While communicating survey results in a timely manner was table stakes, patients also wanted to see summaries of their contributions over time, in order to:

For many patients, monetary compensation was an expected part of participating in clinical research.
While we knew going in this was industry standard, understanding the extent to which this was a primary motivator for many patient populations reinforced the importance of our getting the compensation experience right:

Many patients contribute to research in the hopes of developing new treatments, and improving care for others with their condition.
While it can take years for research like this to produce tangible results, we knew to keep patients engaged, it would be important to create a sense that their contributions were meaningful:
With these insights in mind, as we shifted into the initial phases of design we elected to focus on:
With such an ambitious scope and timeline, it soon became clear that we would need to tackle several components of the platform in parallel, coordinating our efforts such that each would land in sequence with our roadmap.
To ensure the survey platform remained on track, we delineated our efforts into 3 tracks:
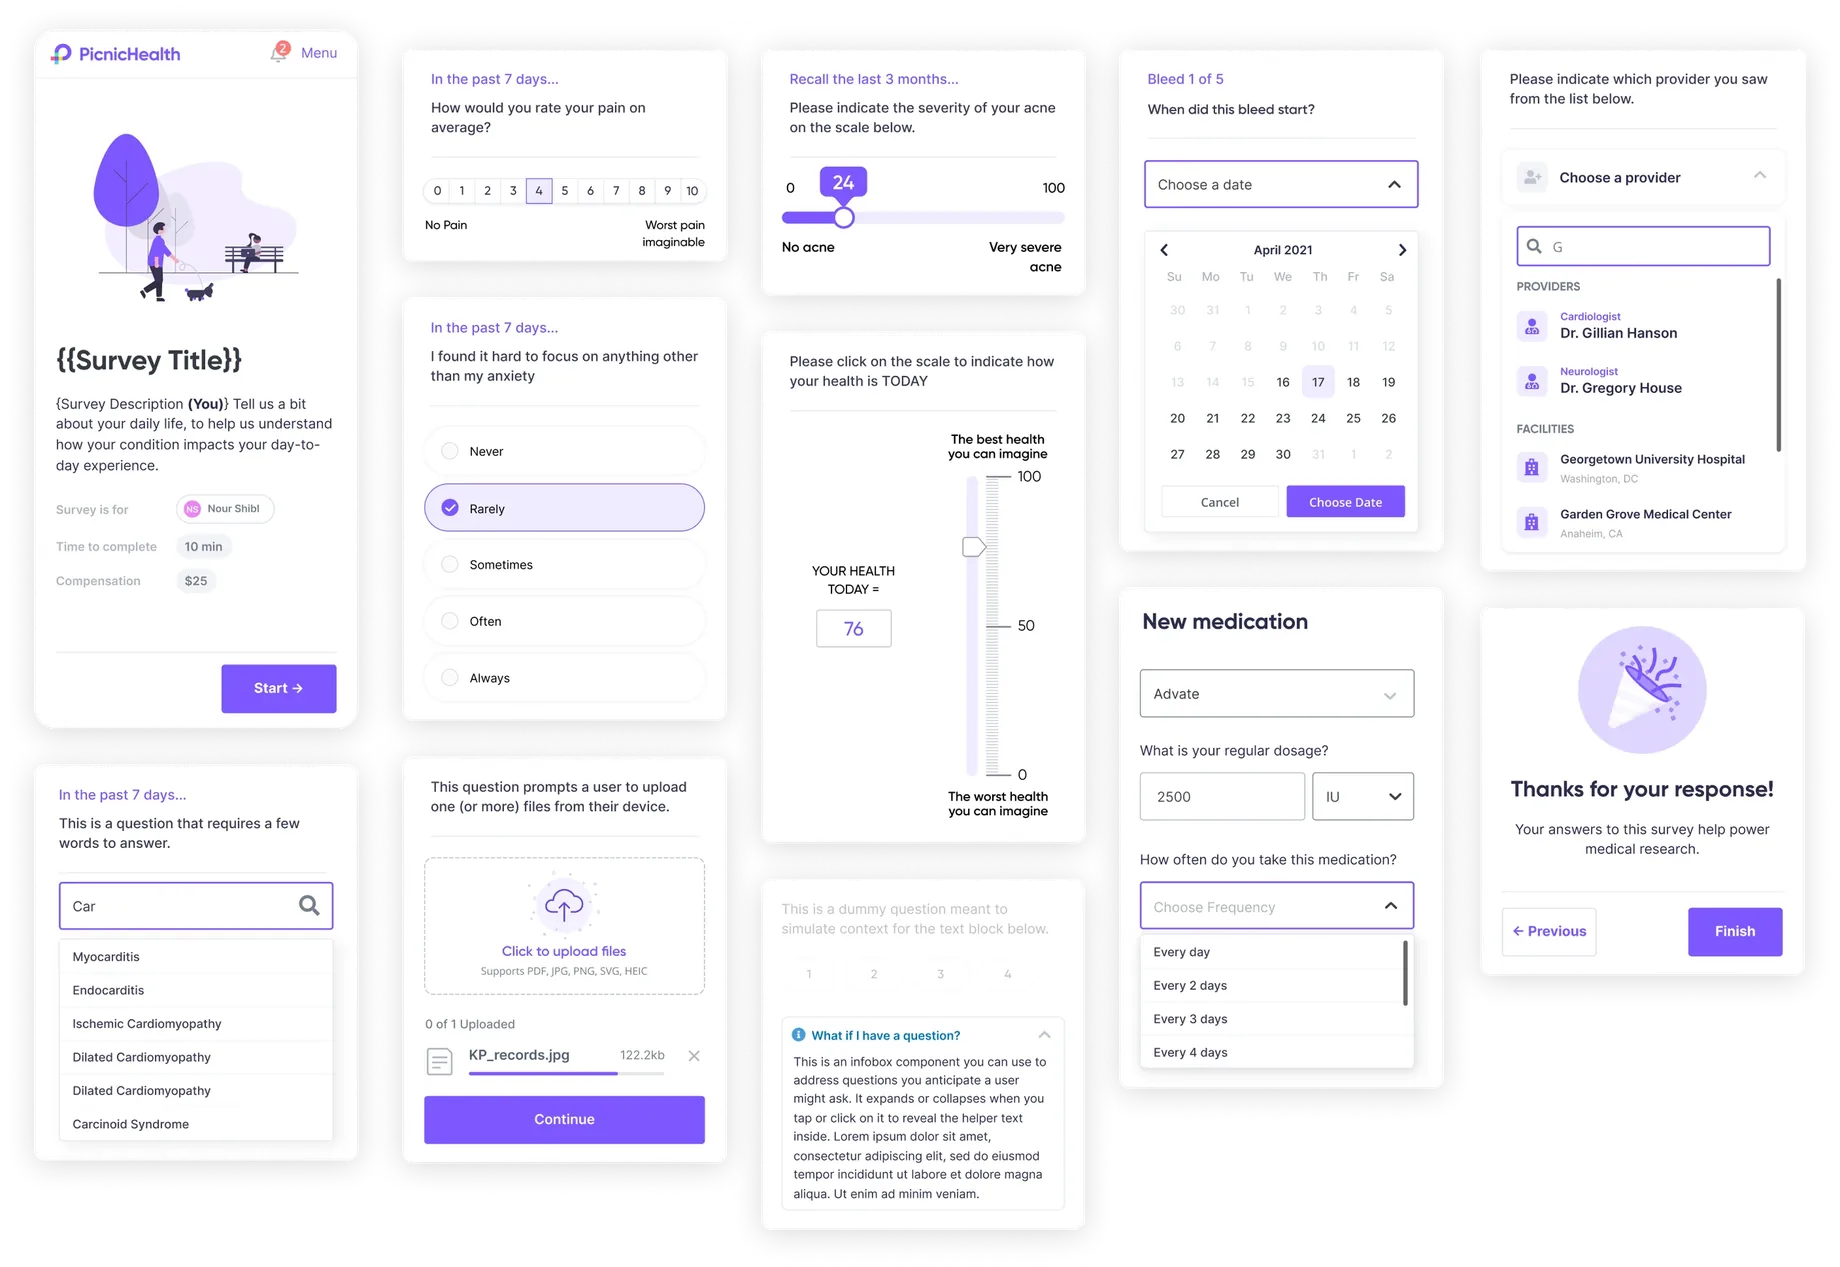
At the core of our surveys platform was the library of question and content modules that would serve as our “building blocks,” from which stakeholders could construct hundreds or thousands of unique surveys.
Each module would need to be designed precisely enough to pass clinical review, yet flexible enough that it could be tailored to a customer’s specifications. Furthermore, each module needed to be intuitive to a range of users, from small children to elderly adults.
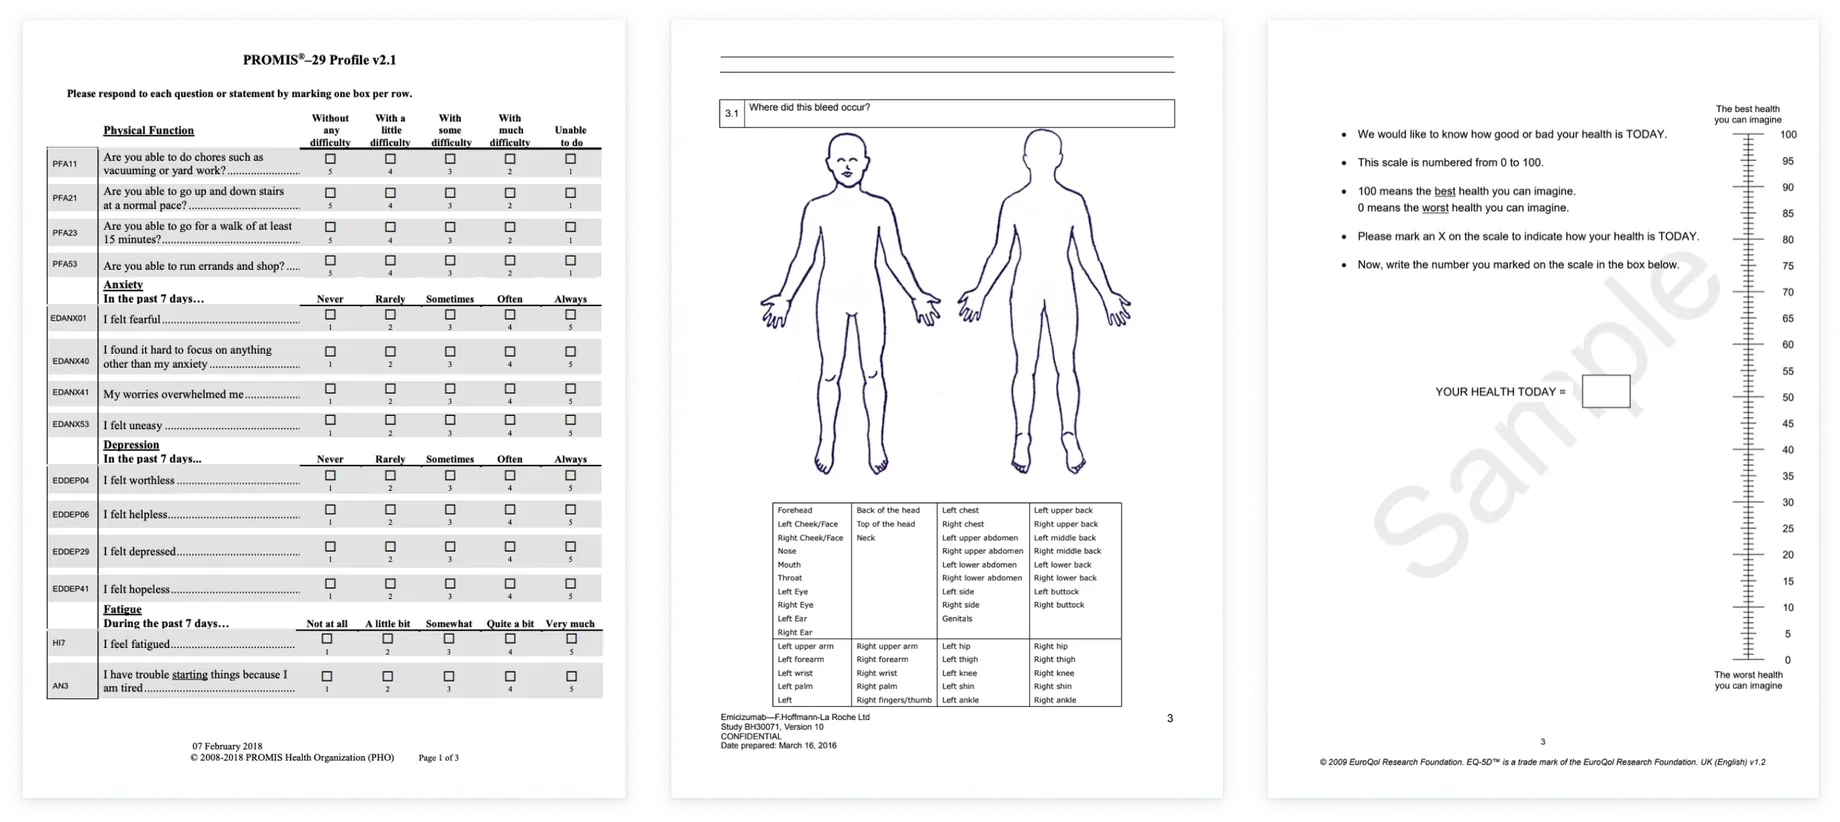
For context, many of the measures we would need to implement were originally designed by researchers to be delivered on paper (see examples below).
As a result, the process of translating these questionnaires to be delivered digitally — on any device — is subject to rigorous clinical validation, to ensure that our implementation wouldn’t bias participant responses, and was closely aligned to the original measures as possible.
While some modules were simple enough that they could be adapted from our existing design system, many were not only completely novel to us, but came with hundreds of pages worth of guidelines (no, really), and were subject to several rounds of review by the publishers.
As a result, the design and implementation of these components was the single most rigorous design review process I or my team have ever been a part of.
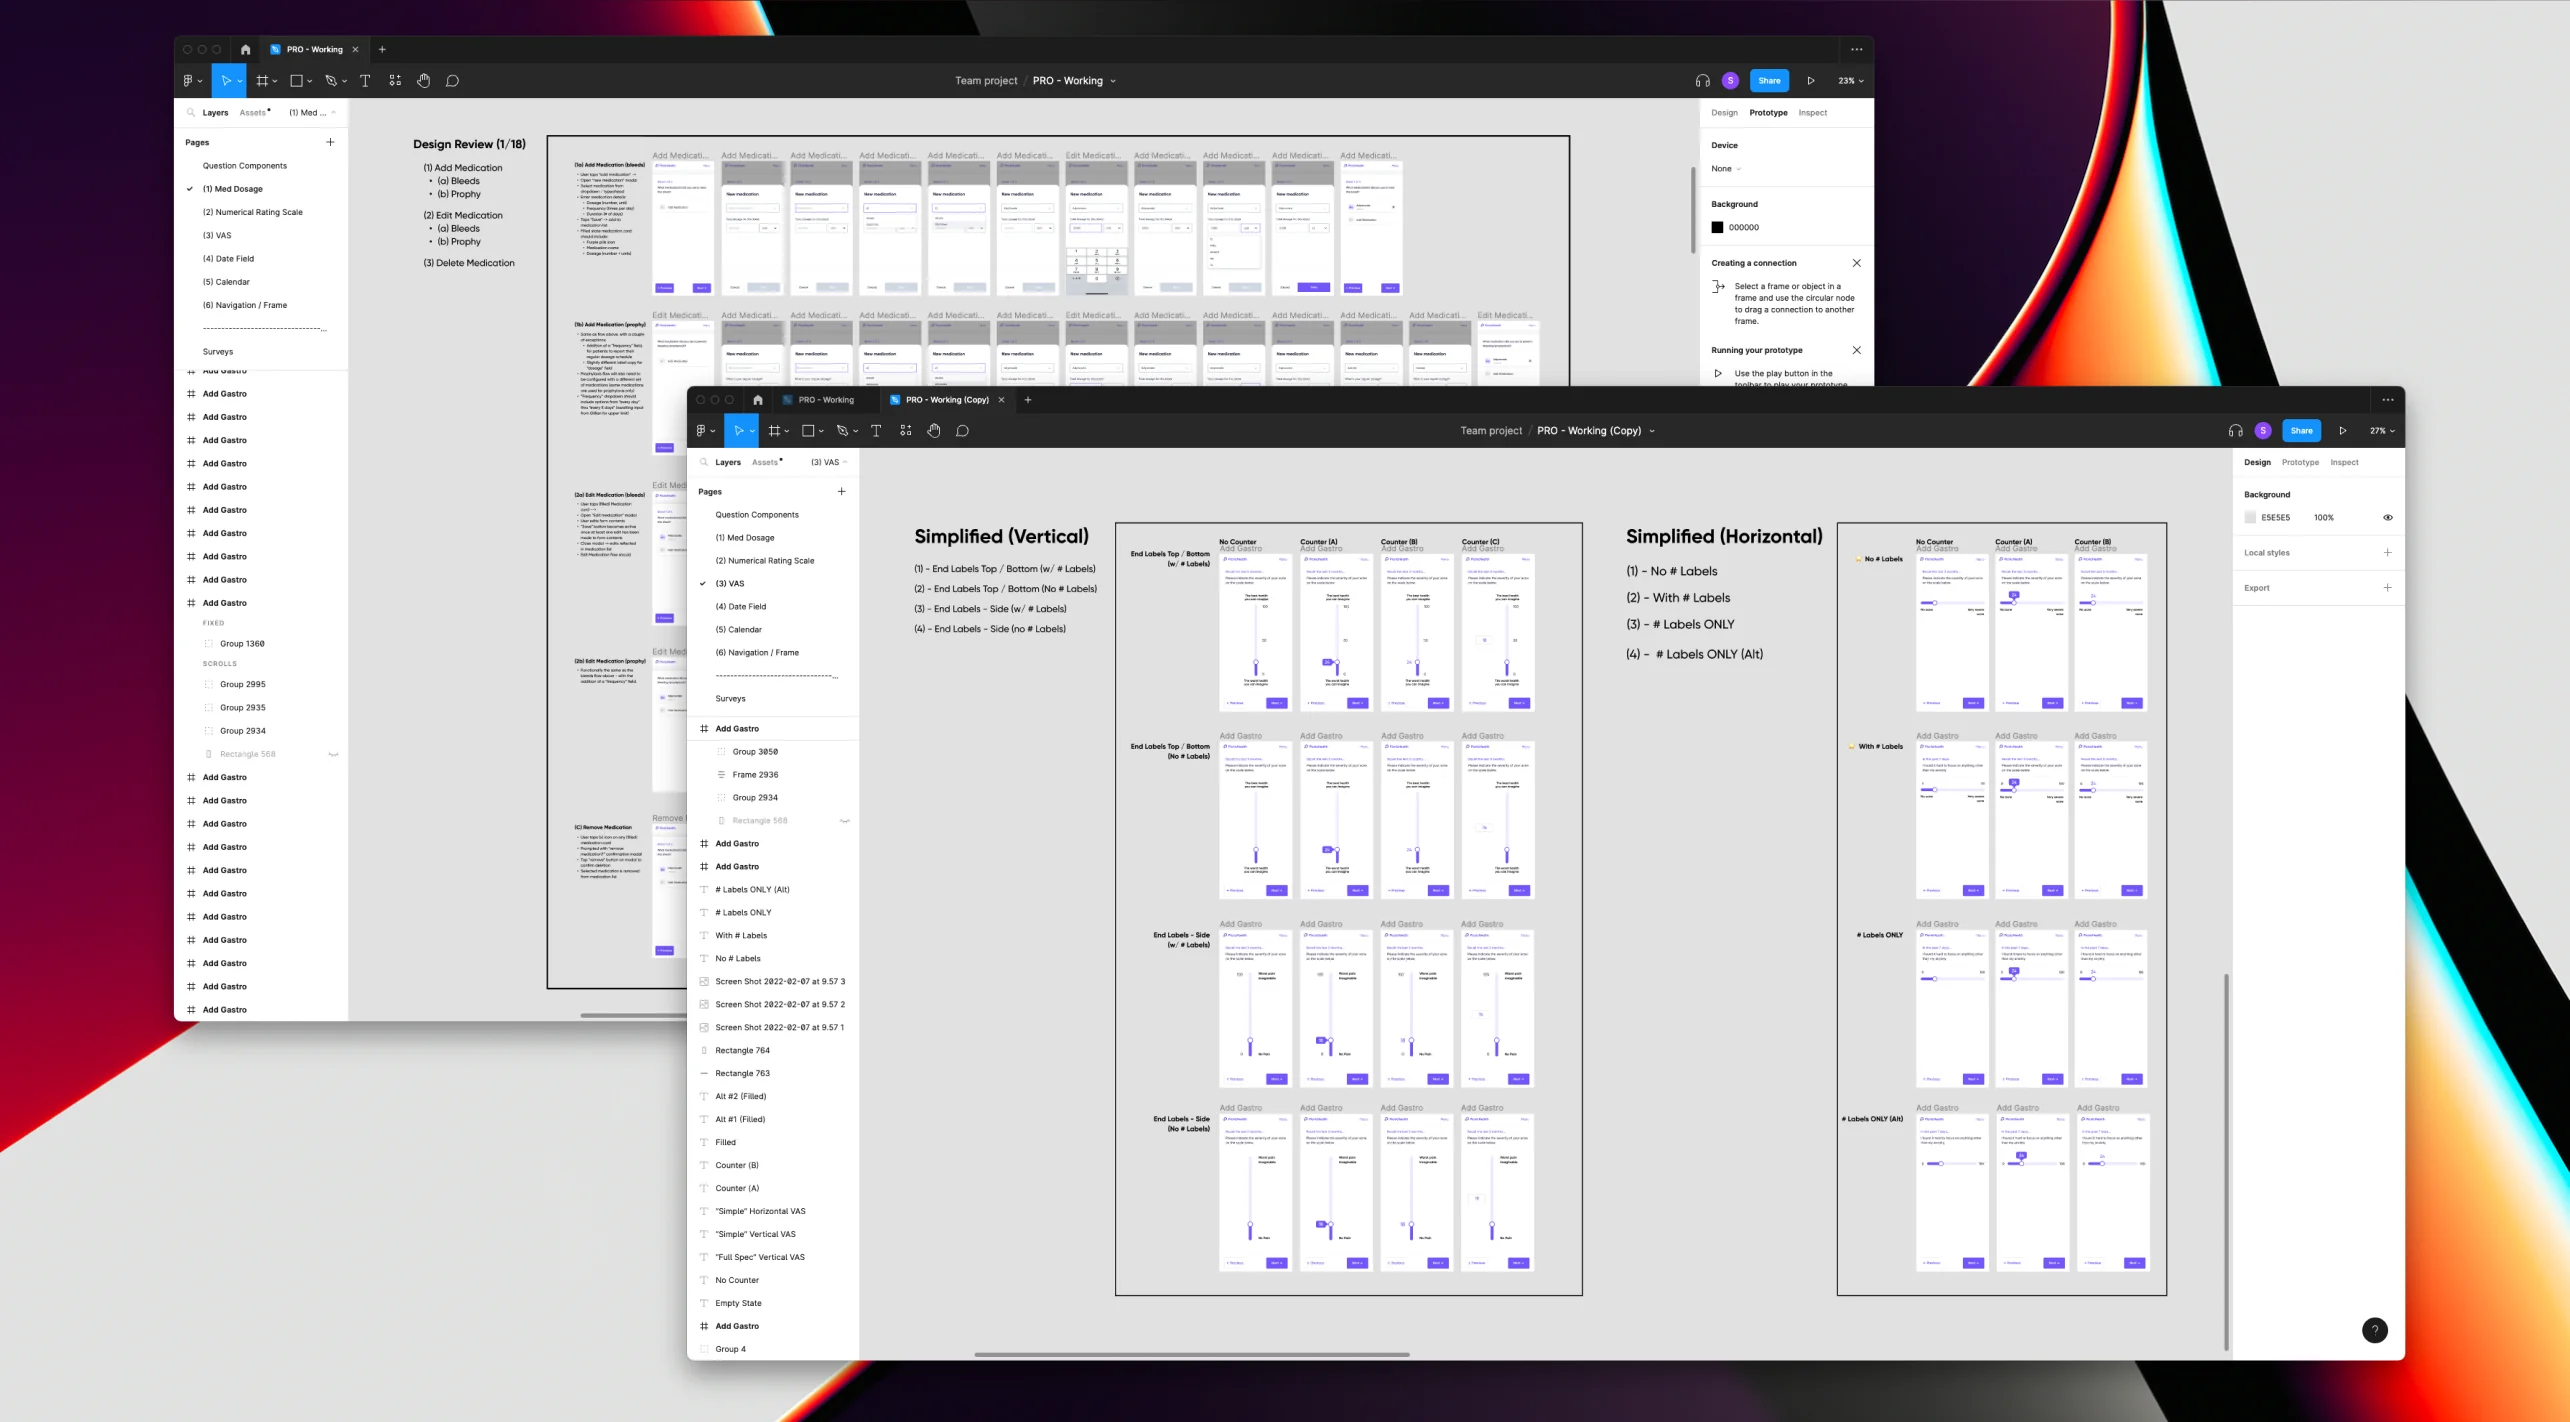
Despite these challenges, clearing this hurdle made for a significant strategic moat for our business. While it took a great deal of time, effort, and talent from our team, gaining approval for these components meant they could be utilized repeatedly, creating a lasting competitive advantage.
Based on our early discovery work, and input gathered from our clinical and sales teams, we initially prioritized the following question modules - each fully configurable with a variety of parameters to ensure they could be tailored to customer’s specifications.
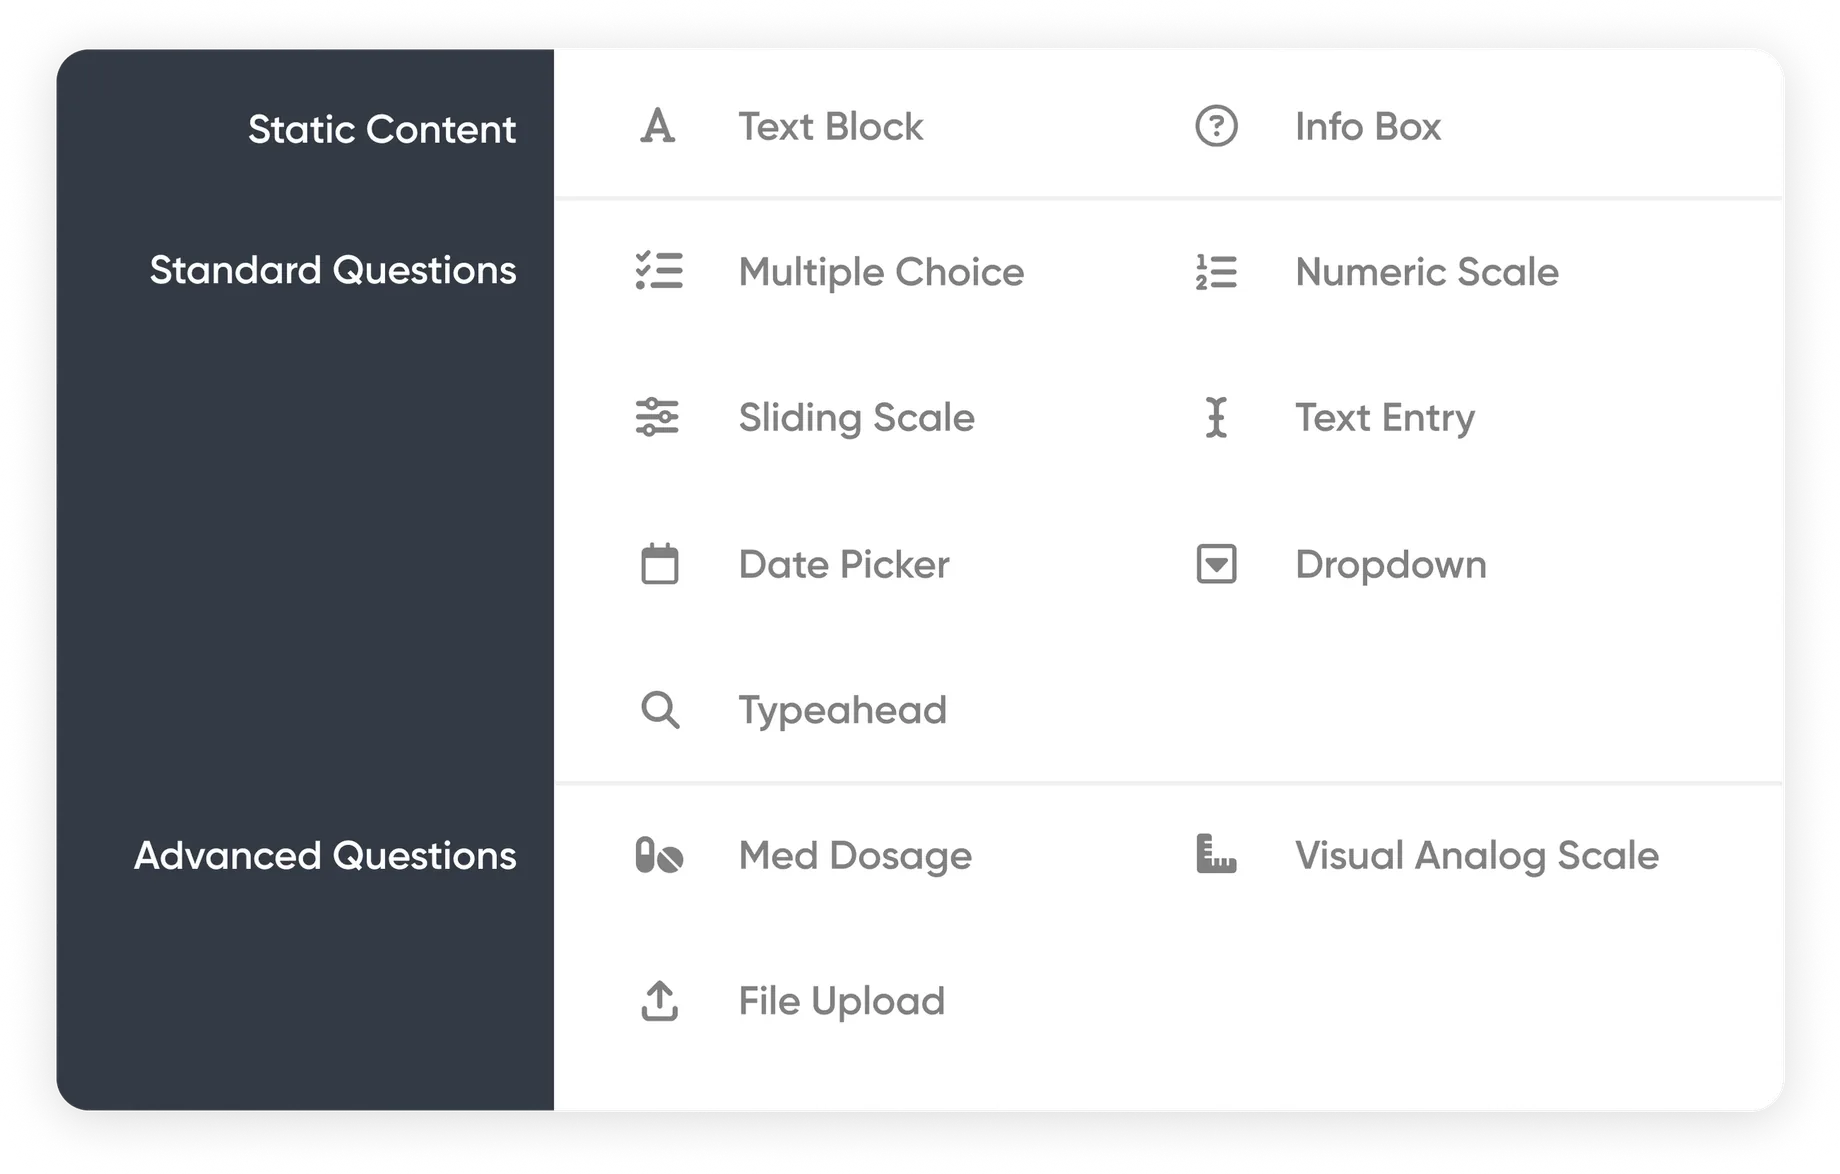
Though more advanced questions and logic would be added to the library later, we were confident that these modules would allow us to implement nearly all of the most common PRO measures (including those that had already been written into contracts).
In parallel with development of the question modules, our team began working on internal tooling to support survey configuration. While building on top of our existing study management tool (“FLEX”) offered a significant leg up, the survey builder largely had to be designed and built from scratch:
For each module, we identified a range of parameters that would need to be configurable in order to support as many implementations as possible. These included things like min / max values, labels, font styles, alignment, as well as input validation and error messages.
While we aimed to provide users of the survey builder with ample flexibility, we also recognized the importance of creating guardrails to ensure the end results would consistently pass clinical review.
In addition to question configuration, we also developed tooling that would enable users to configure and manage every aspect of the end-user experience, including:
Leveraging the Question Library and configuration tools, our team was now able to build, test, and launch new PROs in a matter of hours, with every aspect of the experience precisely calibrated to meet the customer’s requirements.
In the simplest terms, the core user flow can be understood in four stages:
Because PicnicHealth serves patients living with dozens of different conditions, our users could be anyone from a 6-year-old child living with a genetic disorder to a 90-year-old with Alzheimer’s and everyone in between.
While this was a perennial challenge for my team at PicnicHealth, in this case, the mandate was clear: How can we reliably engage patients, regardless of age, demographic, or cognitive ability?
One of the steps we took to better accommodate such a diverse user base was the advent of managed accounts:


Essentially, managed accounts were an alternative to our standard account structure that enabled parents of young children and caretakers of older adults to engage in a more “collaborative” approach to care management.
Leveraging this framework, we mapped out a set of distinct user flows we could use to ensure that surveys would be reliably delivered to the correct audience.
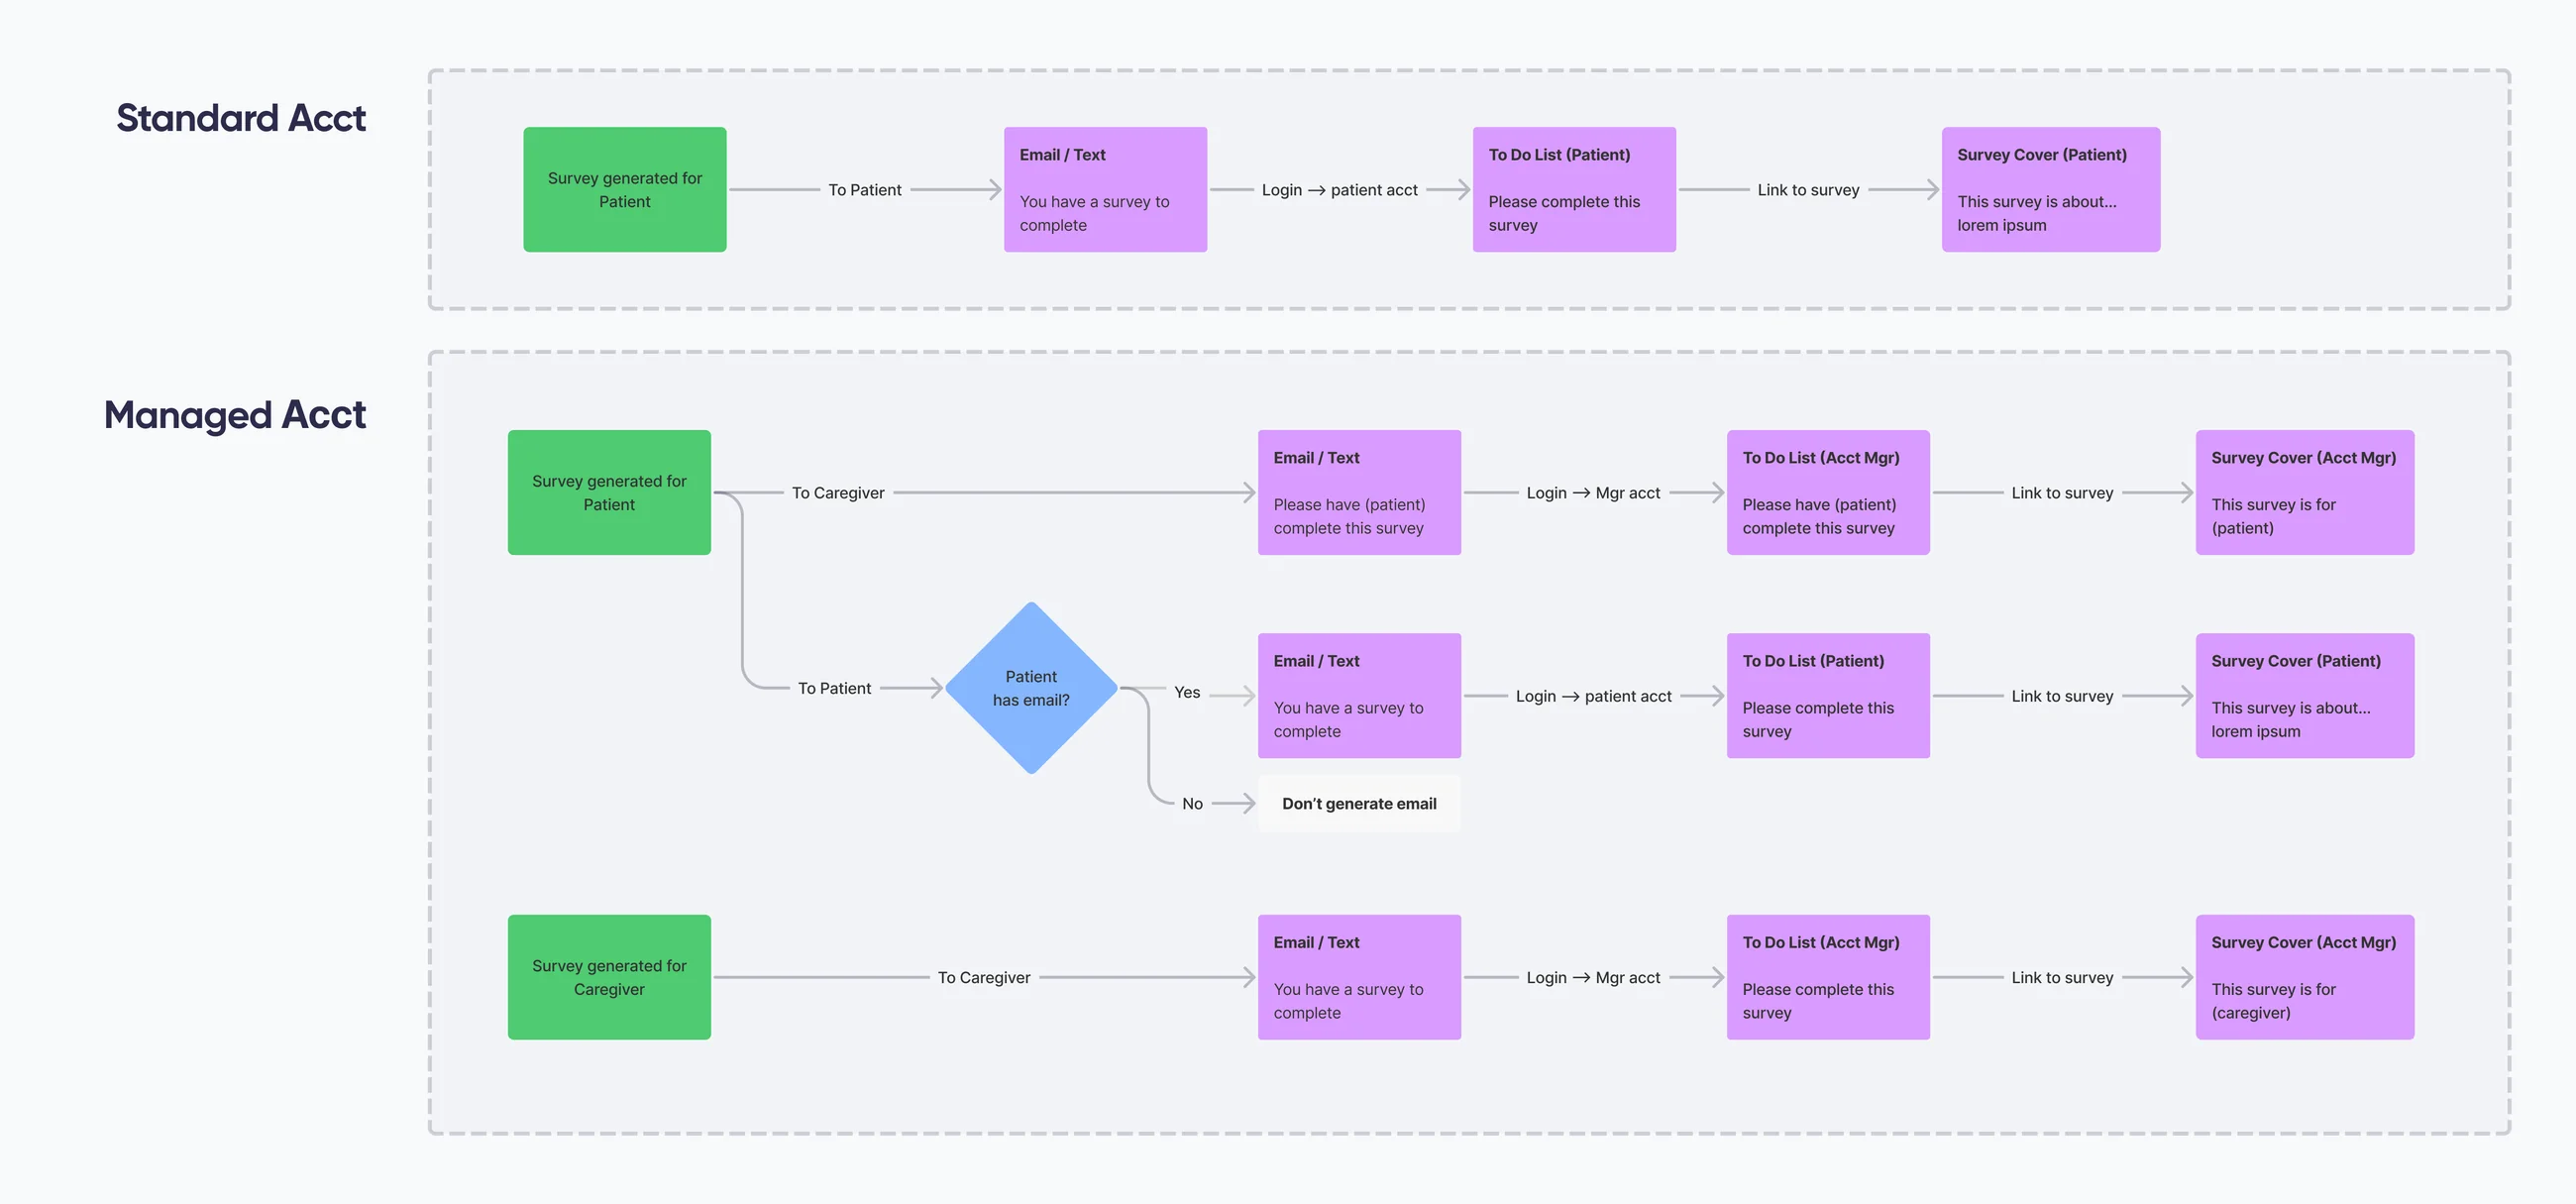
Our solution here needed to accomplish 2 things:
To accomplish these, each surface in the core user flow needed to be tailored to its target audience, including in-app notifications, reminder emails etc. The most critical of these surfaces was the survey cover screen:
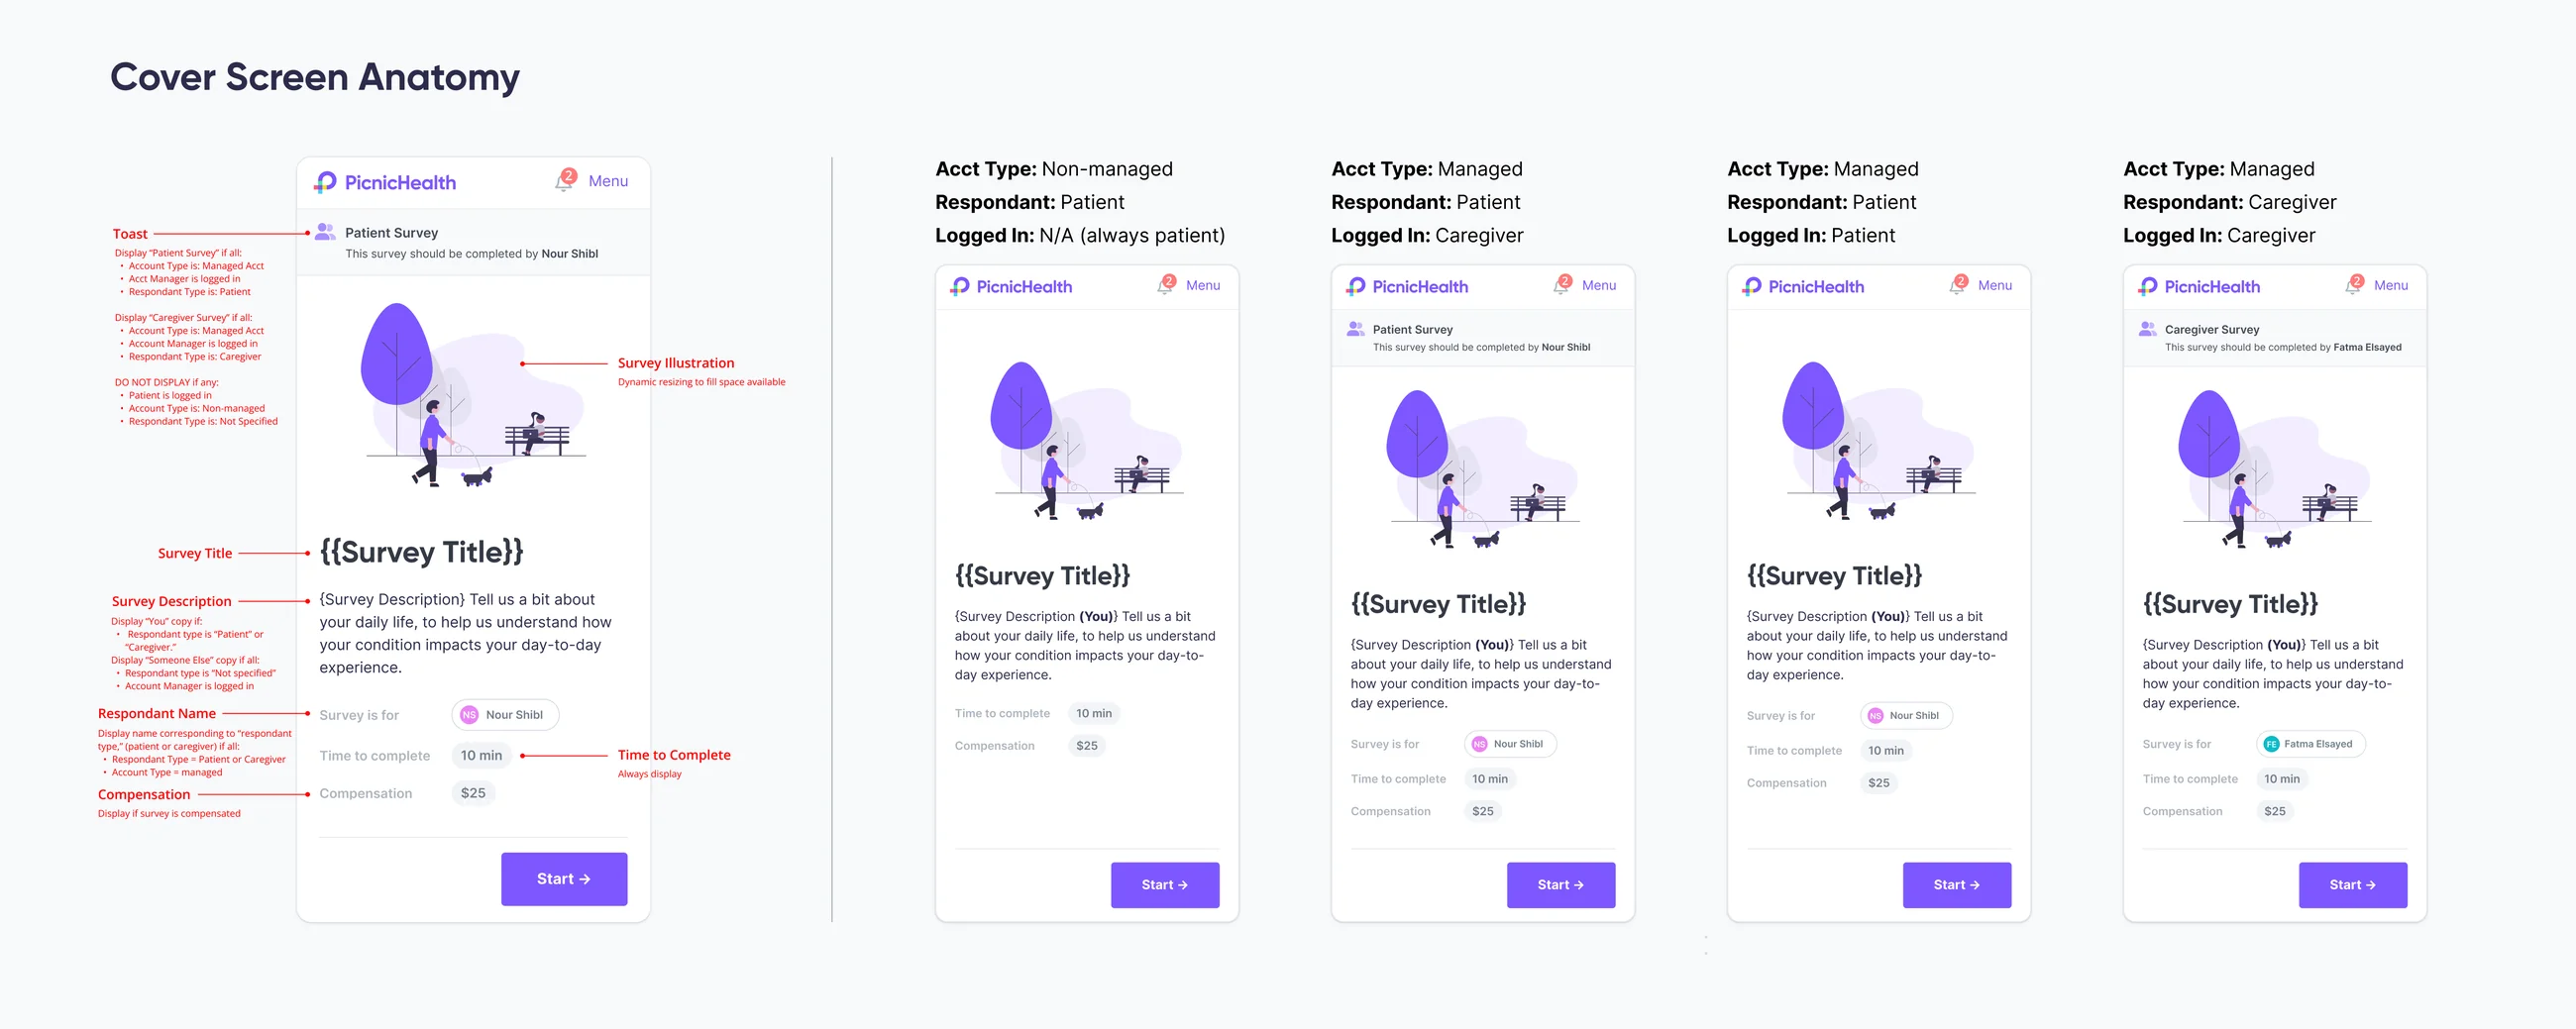
While the cover screen was originally designed to set expectations about the content patients might encounter in the survey — the types of questions they would be asked, how much they would be compensated, how long it would take to complete — we recognized that one of the most crucial expectations to communicate was who should be answering the questions.
To accomplish this, we introduced a few new elements to the cover screen, including a name chip and a toast designating the survey as either patient- or caregiver-facing.
In mid-July, just 6 months after the project began, we successfully launched our first surveys to a small audience. Not only did we note an immediate increase in our survey completion rate, but qualitative research indicated the experience was significant improvement over our previous survey solution.

User testing revealed surveys were an effective and compelling addition to our patient experience.

The patient surveys platform has become PicnicHealth’s fastest-growing product:

Internal tools and streamlined SOPs have enabled our team to scale the platform:
Today, thanks to the hard work of our small team, the Patient Surveys platform has become PicnicHealth’s fastest-growing product, used by over a dozen Fortune 500 companies to conduct patient-centric medical research.
 PicnicHealth
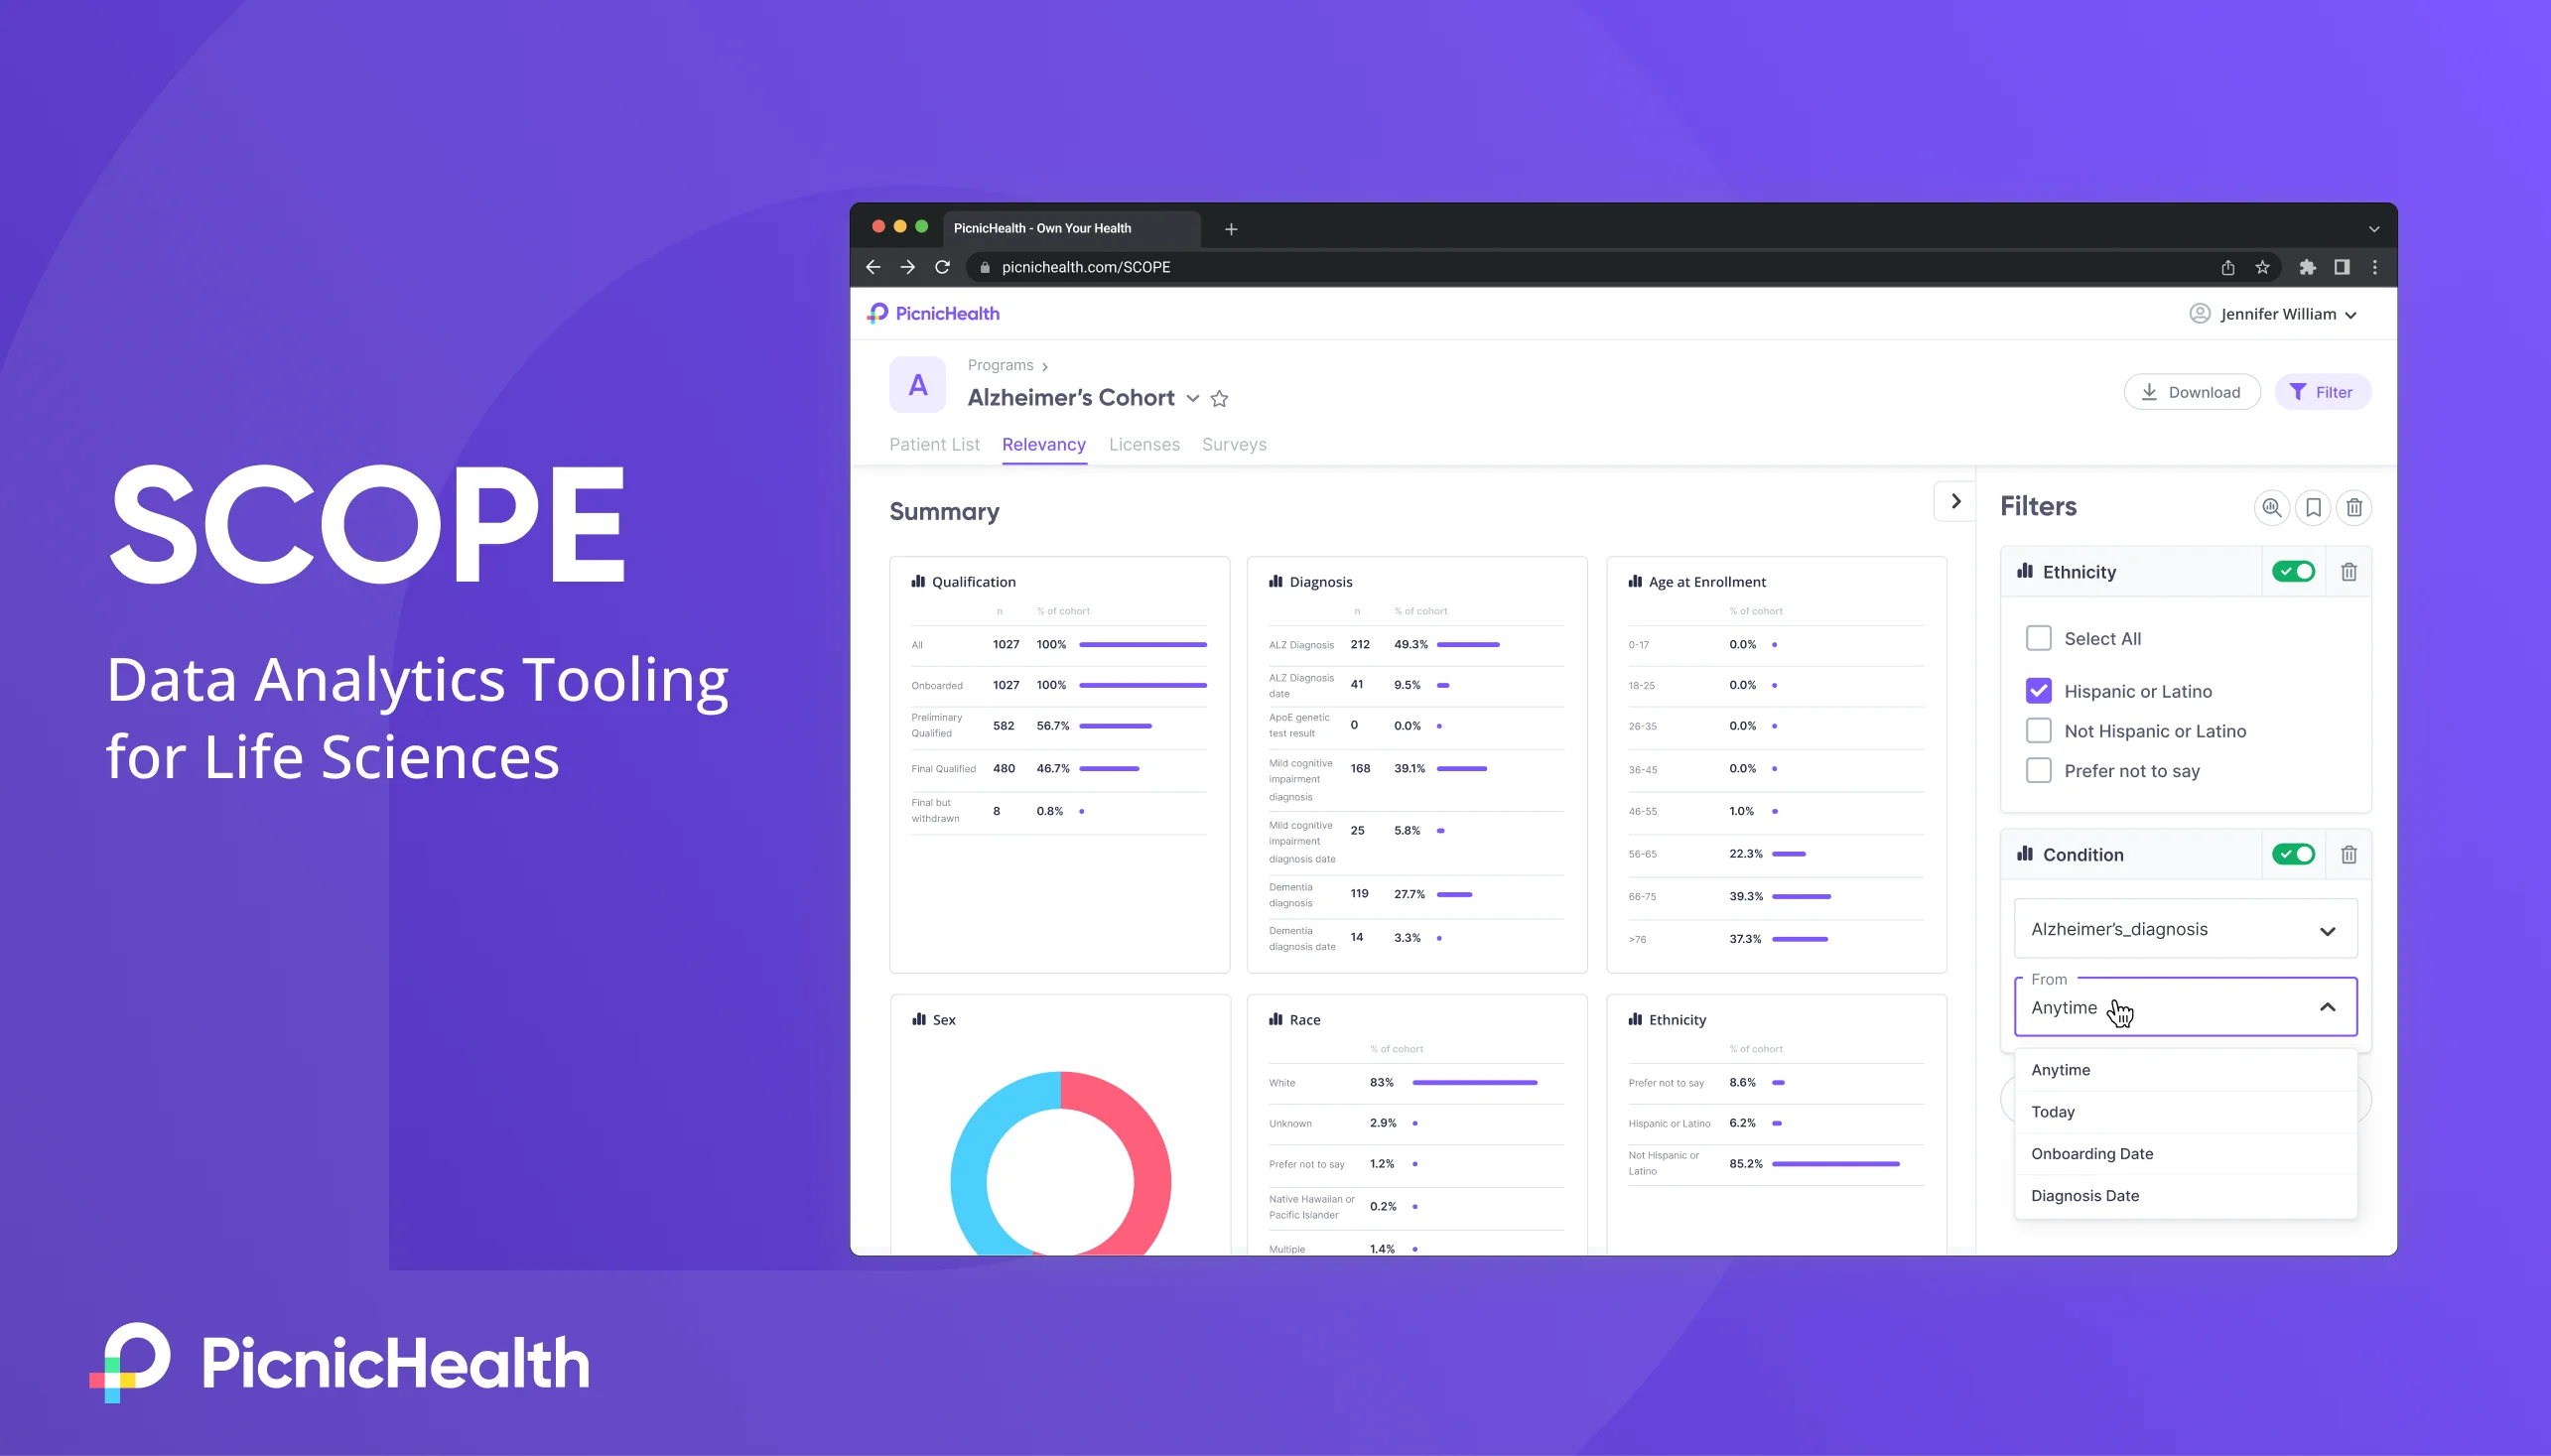
Launched PicnicHealth's first enterprise application — a self-service data analytics platform — including UX research, prototyping, UX/UI design, and data visualization.
EnkasaAs first designer, oversaw foundational user research and conceptual design for Enkasa's integrated real estate & remodeling platform, culminating in a $3M seed.